Sean‘s Week 10 challenge (despite calling it week 9) was a great opportunity to play with some new features in Tableau 2020.1, and reinforce some of the functionality I’ve picked up from some previous #WOW2020 challenges. I was able to complete the Intermediate challenge in our live session today, and got started on the Jedi challenge, which I then figured out the rest of the way tonight. This challenge was kind of fun, since I don’t often use maps at work, so I got to play around with something different. My ability to finish the intermediate challenge in a little over 30 minutes speaks to the amazing work by the Tableau devs in making BUFFER, MAKEPOINT, and DISTANCE such easy functions to use, since I never used them before. (Also, the blogs Sean shared from Zen Master Marc Reid and Tableau developer Filippos Lymperopoulos were great intros on how to apply these functions, and directly led to my being able to do the following work)
Intermediate Challenge
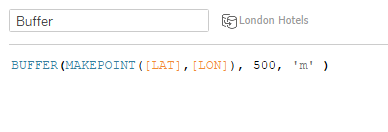
I started off just testing out a BUFFER calculation on the London Hotels data source. Pretty easy when you have Latitude/Longitude for your data points.

The MAKEPOINT converts your Lat/Lon into a point on the map, and then you tell the BUFFER how big of a radius you want (500) and what unit of measure (in this case meters, or ‘m’). Once I saw how that worked I went back into the data source viewer and joined the London Pubs csv using an Intersects join:

Here we’re basically joining points on the map where pubs exist within any buffer areas around the hotels. By doing an Inner Join we remove the hotels that don’t have any pubs within the 500m radius.
**SIDENOTE: New sometime around 2019.4 is a whole slew of additional background maps. Here’s the list of options in 2019.2:

And here’s 2020.1:

Great options for those of us who have yet to dip our toe in the pool of Mapbox. **
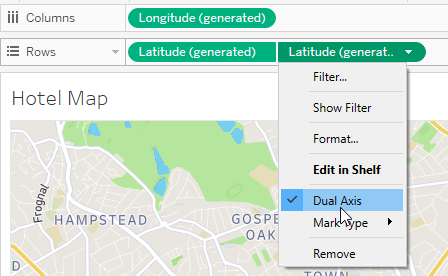
When I went back to my map, I was trying to play around with getting the pubs to show, and struggled for a minute until I realized I was only showing the Hotels LAT/LON in the view. After I joined Hotels and Pubs, the Latitude (generated) and Longitude (generated) showed up in Measures. Once I dropped those into Columns/Rows, I was in business. In order to get the buffer for hotels and the circle marks for pubs, you have to use a dual axis. This is easily done in maps by Ctrl+clicking on Latitude (generated) and dragging it next to the current one, then selecting dual axis from the pill dropdown:

In order to apply the buffer to your view, you just drag your Buffer calc to Detail on the marks card. I also added Hotel Name to Detail, and COUNTD(Pub Name) to Label, which gave the bold numbers within the buffer (once I adjusted the font size and made it bold).
I then needed to calculate the distance between each hotel and pub within the radius. This is just DISTANCE between two points, and the unit of measure:

Once I had the distance calculated, I could create the points on the map for the pubs:

(I created a Radius parameter, which in this case is set to 500) I then added this calc to Detail, along with Pub Name. I switched the mark type to Circle, but the circles weren’t as big as Sean’s were, and wouldn’t change as I adjusted the size. So I hacked it with MIN(1) on Size. That still gave me some trouble so I adjusted the size settings:

This allowed me to adjust the size of the circles to match Sean’s. Then I matched the colors and opacity. That just left me with the tooltip.
The tooltip was just a basic table with Pub Name and distance from hotel. But since it was showing up on the buffer around the hotels, Pub Name wasn’t an option for the tooltip filter. So I added Hotel Name to the detail, and filtered the viz in tooltip on that:

Drop everything into the 700×700 dash, and we’re done!

Jedi Challenge
I was excited to combine this newly found “skill” with some others I had gained previously when I looked at what the Jedi challenge was, so I jumped into it.
I started with the table just because I knew it would be fairly straight forward. After adding Name, Yelp Rating, Price Rating, and SUM(Yelp # of Ratings) to the view, I realized I would need something to sort the hotels based on the selected option. So I started with the parameter:

Then I created my case statement:

The Price Rating was kind of weird, because the Null for Great Scotland Yard Hotel was showing up at the top, rather than the bottom, plus the other two ratings needed to sort Descending, while the Price Rating needed to sort Ascending. So I turned the Null into 5 using the IFNULL function, and made Price Rating negative. Then I added Sort to the far left of the Rows shelf, and sorted by Sort and Name (Descending for both).

I also added the Yelp # of Ratings to label for the Min/Max at the Table scope. In order to keep the axis label of #of Ratings, but not have the axis, I just formatted the axis to be a white font, and then adjusted the title format to be black.
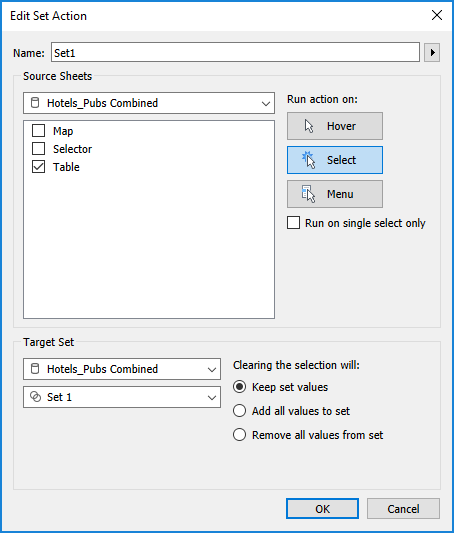
I also created a set on Name. Then created a Set Action to change the set to the selected hotel:

Once I had that, I could drag Set 1 to color, change the blue to red, and my table was ready to go.
Then I jumped into the map. I used the same basic dual axis principles from the intermediate challenge, but this time, in order to just get the selected hotel, my buffer calc looked like this:

Hotel Location was kind of tricky, because I needed it to be kind of a constant in order to calculate the distance from the pubs. So first I found the individual Latitude and Longitude for the hotel in the set:

And then I used an LOD to make the point for each data row:

I could then use that in conjunction with Pub Location:

To find the distance between the selected hotel and each pub:

So one marks card had the Buffer in Detail and Name on Label. The other had Pub Location and Name on Detail (I forgot Name, and the distance calc wasn’t working for me and I couldn’t figure out why the heck not…til I realized I wasn’t giving it a pub to calculate the distance for…oops!), with AVG(Distance) on Color and Size. I adjusted the color and played with size to match Sean’s viz, but needed one more calc in order to include the selected Hotel in the tooltip:

With map and table in hand, all I had left was the selector sheet and some actions. The selector sheet was very similar to Week 4, so I won’t belabor it here. I made one calc for the three options:

and another for the shape:

Throw in TRUE and FALSE for the auto deselect and min(0.0) [(both previously mentioned here various times)], and we’re ready to hit the dashboard.
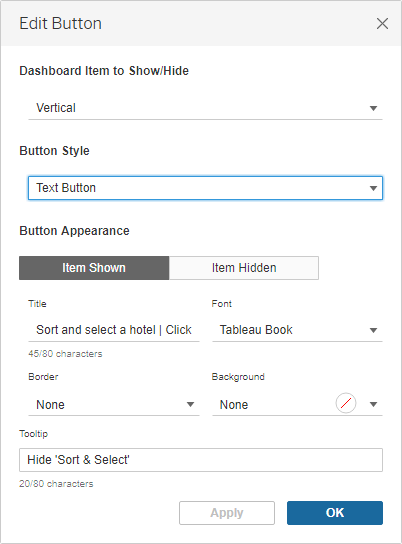
I had no idea how to do the appearing/disappearing container for the selector/table other than it would be a floating vertical container with the Selector and Table sheets. But I knew Lindsey Poulter blogged about how she did a similar thing in her Iron Viz. And the magic is remarkably simple…click the dropdown arrow on the container you want to show/hide, and then:

That brings up this nifty little window where you can choose an image or a text button, and what they look like when it’s shown or hidden:

I really was expecting this part to be more complicated, but it wasn’t!
Added the legends and buffer radius parameter entry, some final testing, and we’re all done!


I’ve really loved Sean’s challenges as a guest host the last couple months. They’ve really helped me dig into and learn great new functionalities in Tableau that are directly applicable in my work projects. Well done Sean!