As I neared the end of my first year using Tableau, I was starting to feel more comfortable with building vizzes and dashboards, but they were all pretty static. Everything was white background and tiled (I hadn’t had the container enlightenment yet). Then I came across Mark Jackson‘s Quantified Self / Career Bio on Tableau Public.
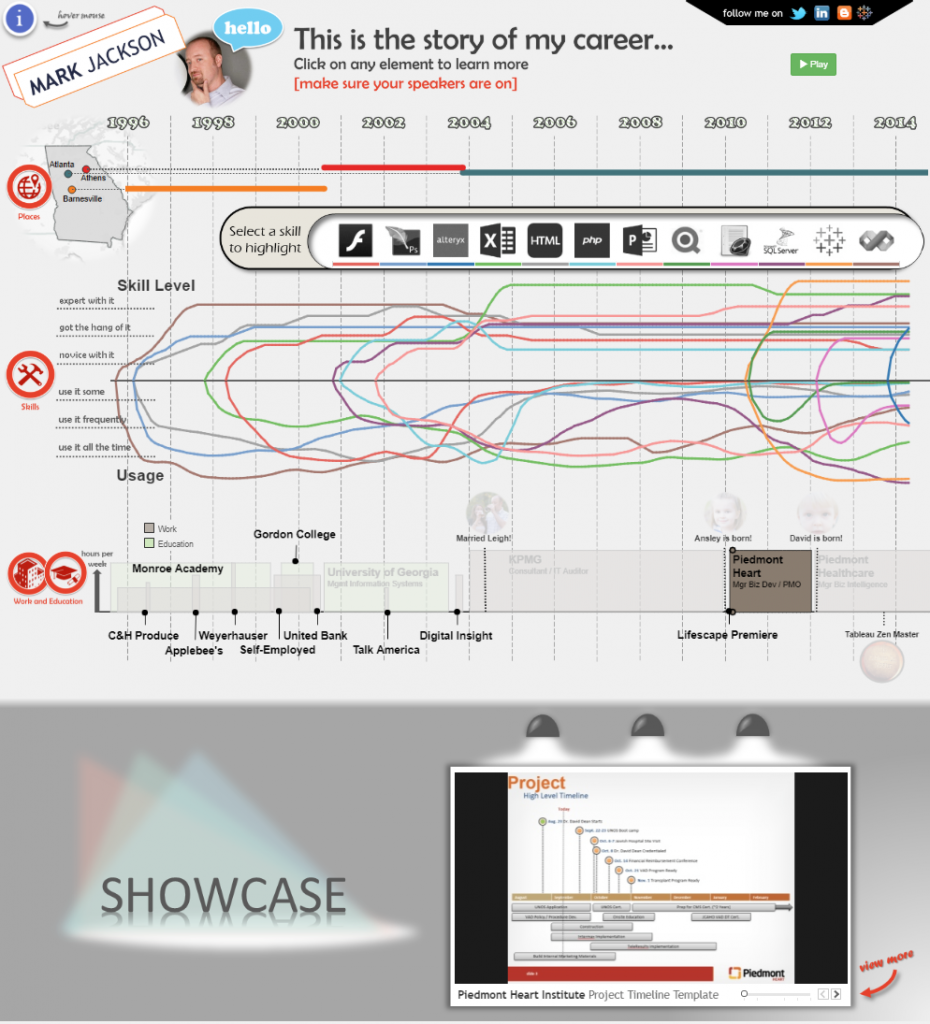
This was kind of a revelation to me. I had been following Viz of the Day on Tableau Public and got to see some really cool examples, but the combination of viz elements with the graphics and how they all intertwined was kind of mind-blowing to me. But I thought it would be a great learning experience to figure out how Mark built it, so I decided to make my own version.
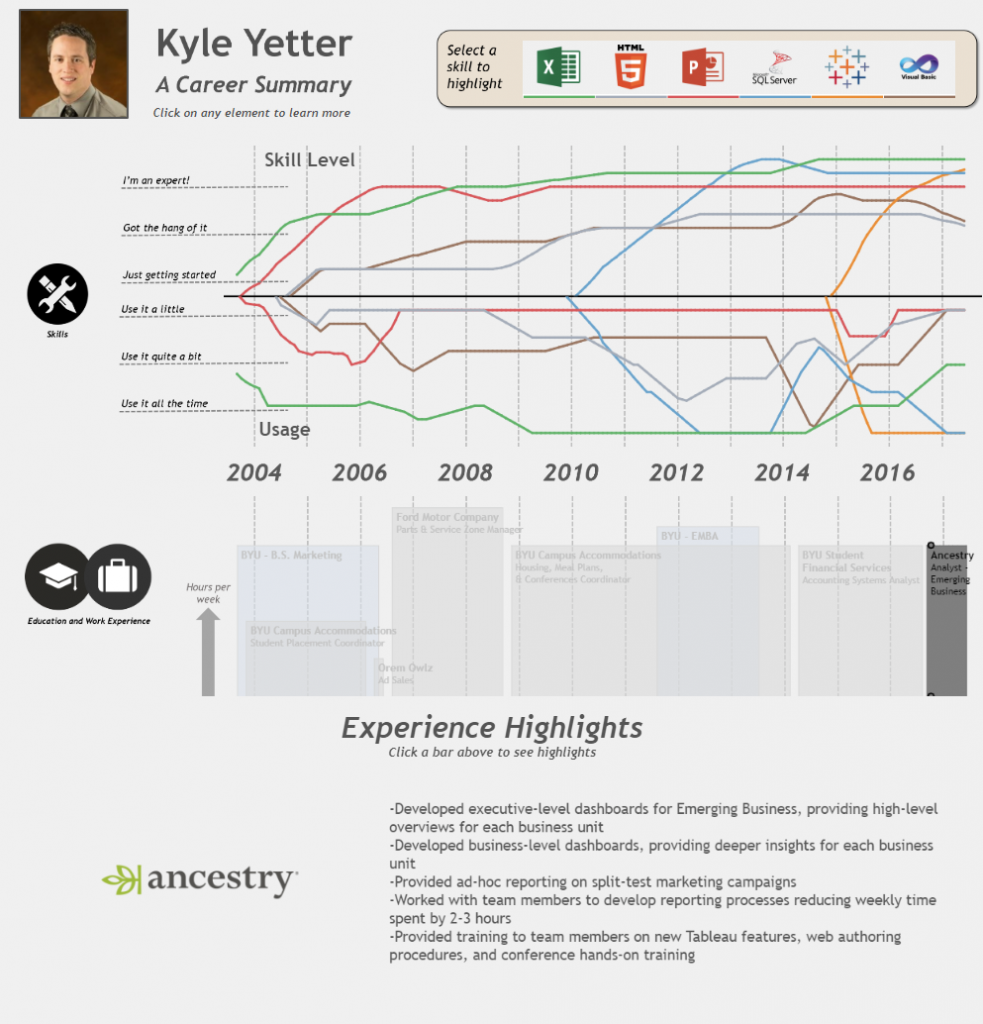
This project helped me really cement a few things in my use of Tableau. One of the first was identifying how data should be best organized to build a viz. All of this data was self-quantified, so I had to think through how it should be structured and went through a few iterations as I developed. This was also the first time (I think) I had ever built a whole dashboard with floating elements. I think it was also my first experience really using shapes, particularly custom shapes and identifying that I can just drop images into the Shapes folder of My Tableau Repository and they are available to use in a viz.
As I think about these things now, they all seem very basic in comparison to many of the things I’ve learned in the 4 years since that time. But early in my Tableau journey, building my own iteration of Mark’s viz helped me really broaden my understanding of what could be done in Tableau and laid a foundation for future growth.
So thanks, Mark, for the inspiration early on in my journey.
Here’s my viz (admittedly a bit out of date):