Ann‘s challenge this week was to create a connected scatterplot with some automatic insights. I totally went down the wrong path, so it took me a bit longer than it should have. But we figured out two different ways to do things!
I started with the scatterplot. I placed SUM(Quantity) on Columns, and Profit Ratio on Rows. Then I added Category to Color, set the colors per Ann’s viz, and set the mark type to Circle. Next, I created a custom date from Order Date:
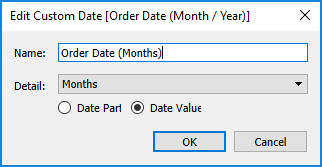
This just made it easier to use in the Detail and calculations. So I dropped that on Detail, and now I have all the dots I need.
For the connected part of the scatterplot, I did a quick search and found Ryan Sleeper’s blog post about how to build one. The variant here is I only need it to connect when something is selected. So first I created a set from Category, and then created a calc to give me the value if the set was true:
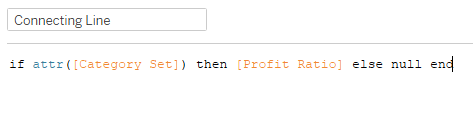
Now I can take this calc and add it as a dual axis on Rows (since I set it to be Profit Ratio). Then I want that mark to be a Line, with Category on Color again, and then the Order Date (Months) on Path and Label. The last thing we need here is the Set Action to make it work:
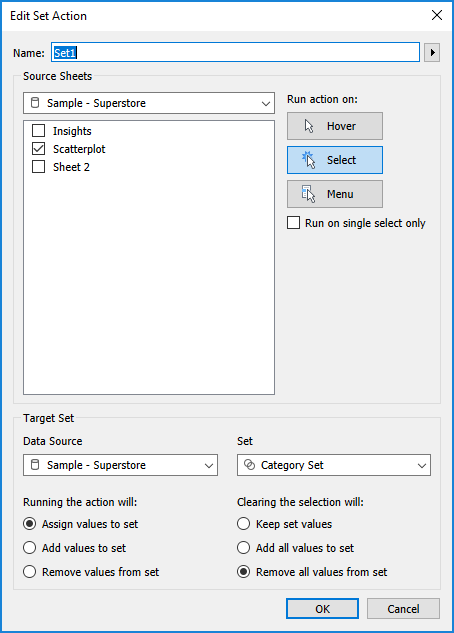
At least I thought that was the last thing. But when I clicked on dots, while the line would show up, only the dot was highlighting. So in addition to the Set Action, I needed a Highlight Action:
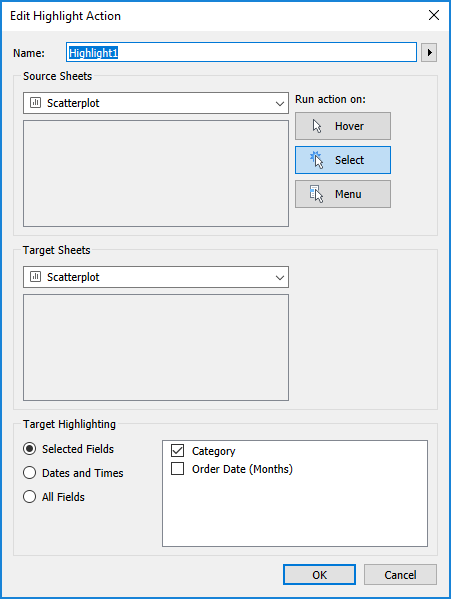
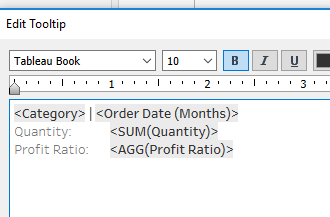
With these actions in place, just need to clean up the tooltip, and this sheet is complete:
As I was starting down the Insights path, I started out using LODs. But I kept running into issues with aggregation or something. So we decided to go down the table calculation route. And we got it to work, with the exception of the INSIGHTS title. So I’m going to go through what we did, just as a learning exercise, even though it didn’t quite match close enough to Ann’s version for my liking.
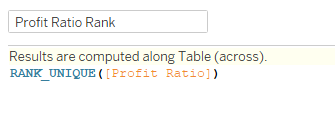
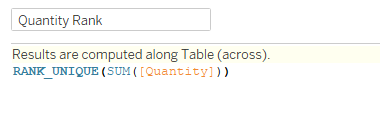
I started with ranking the Profit Ratio and Quantity:
Then used these ranks to identify the desired month values:
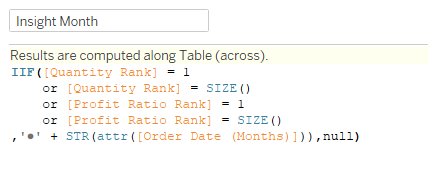
So if the rank is 1 (top) or equal to SIZE (bottom), then give me the bullet point plus the string of the month.
Then we did a similar thing for the text in between the month and the value:
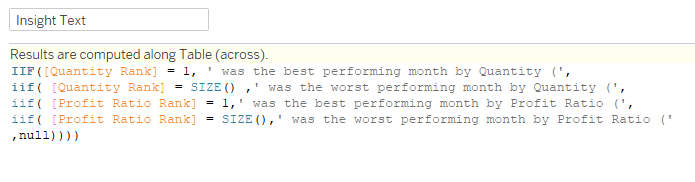
This time instead of OR, I needed nested IIFs because each text line is different.
Lastly, we need the value for each one:
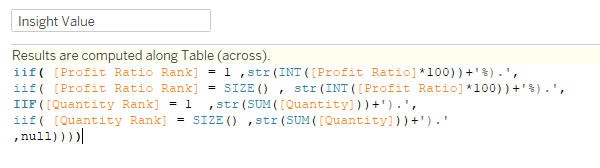
To get a clean percentage on the Profit Ratio, we multiply the PR by 100, then take the INT, and add the percentage in our ending string.
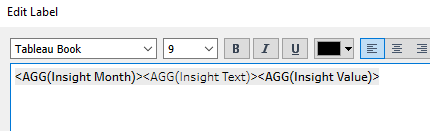
Now we add all three of these to Text, and setup the label:
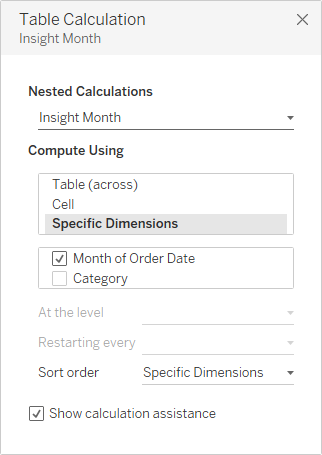
Each of the table calcs needs to be set to process on the Order Date (included the nested rank calcs in each):
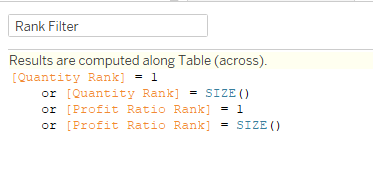
In order to get only the 4 items we want to show up, we can create a Rank Filter:
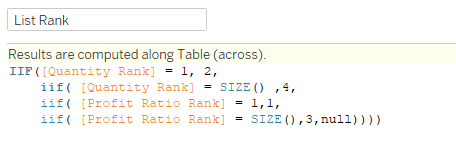
Then we can create a variant on this calc to create a ranking order to get them to appear in the correct order:
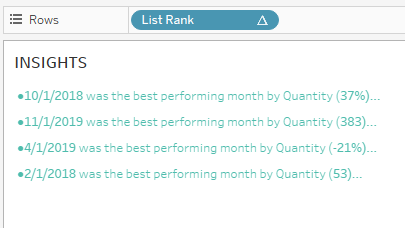
When we add this to Rows, it has a Null followed by 1,2,3,4. So I excluded the Nulls, unchecked Show Header, and we have our insights:
The issue with this solution is that we couldn’t get INSIGHTS to follow the color scheme without adding it to the Label, but then that messed up the spacing for each of the rows. But aside from that, this solution gather the information we were looking for. (I didn’t bother formatting the dates in this portion)
Now for the other solution, which actually did use LODs. I think I’ve gotten so used to having to figure out Table Calcs for WOW that I just dismissed my LOD solution prematurely. So once I stepped back and thought through it (see also: peak at Ann’s sheet), it made total sense.
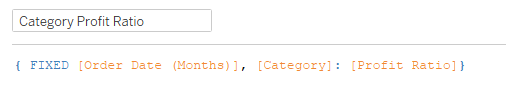
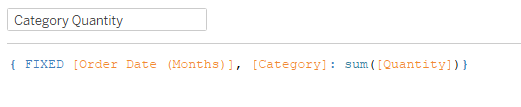
We start with the Profit Ratio and Quantity by Category and Month:
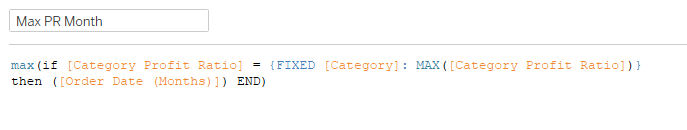
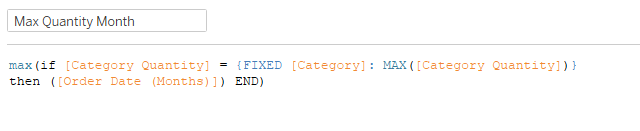
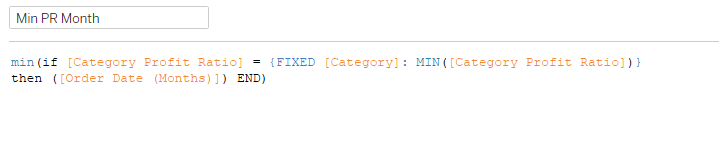
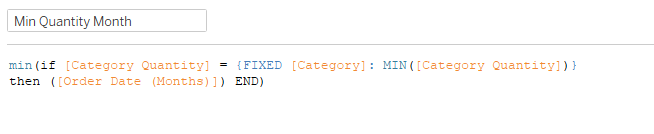
Then you add the MIN and MAX of each to Text. Next we need four different calcs for each of the four months we need. These calcs check to see if the Category Profit Ratio or Quantity equal the MIN or MAX fixed on the Category, and return the Order Date (Months) if they do:
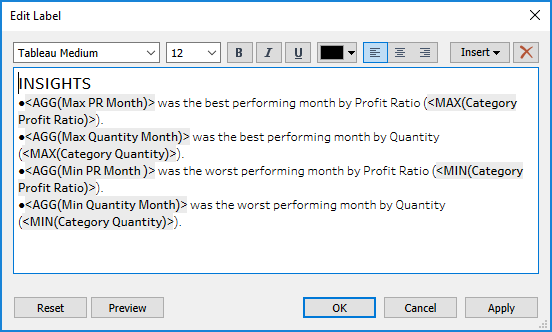
Then we add all of those to Text,add Category to Color, and the Category Set to filter, and set up the Label:
This was definitely the more simple solution for this Insights, even though it involved a few more calcs.
In the dashboard, I set things up in a Vertical Container (title, black bar, sub title, scatterplot, footer):
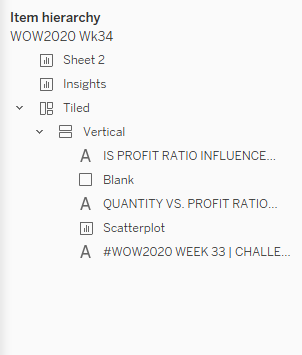
Because of the location of the Insights sheet, it needed to float. (I also floated Sheet 2, in case anyone wanted to see how that sheet worked. But in order to hide it, it has to be on the dashboard. So I set it to 1 x 1 size floating in the left corner.)
And we’re done!