After Luke‘s challenge stumped me last week I’ve been looking forward to a little redemption this week. As always, Ann‘s challenge was pretty straight forward with plenty of little twists. Because of those twists, and what it meant for my solution, I’m probably going to bounce around all over the place in my walkthrough this week. Apologies in advance…
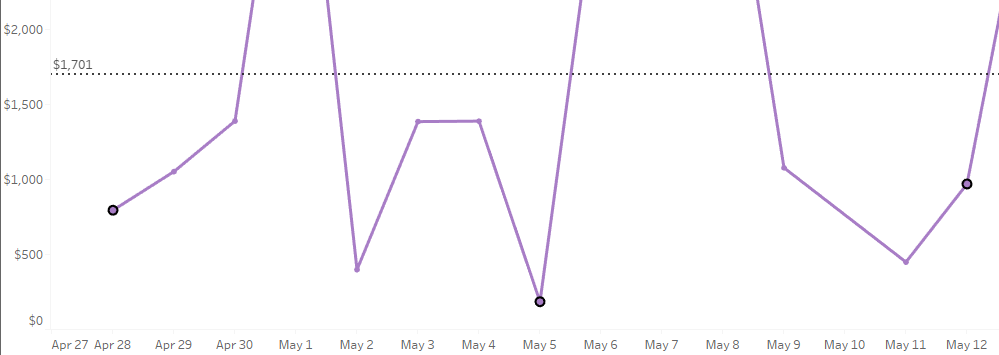
I started off building the weekly view. Pretty basic, SUM(Sales) on rows, Week(Order Date) on columns. I would later come to find this was wrong, but roll with me here. I added the average line, and even updated the tooltips early on instead of waiting until the end! One thing I realized was when I format the date on the axis (mmm d, yy), it makes that the format in the tooltip. So I created a custom date for the week of Order Date, which allowed me to format mm/dd/yyyy for the tooltip.
Since Ann said 2 sheets, I figured I would have one for the weekly, then one for the daily. So I built the daily sheet, similar to the weekly. As we (I do this live with a group at work) talked through how to set the dates, I started down the path with Sets. But as I started on that, I realized I didn’t have a great way to get the MIN or MAX date from the set values. It was just giving me TRUE/FALSE in calculations, and I wanted the MIN/MAX values that were IN the set. As I talk through it now, having looked at Ann’s solution, I realize I could have made it work. But, we didn’t see the path forward at the time, so we did it differently! (Hooray, always more than one way to accomplish things in Tableau!)
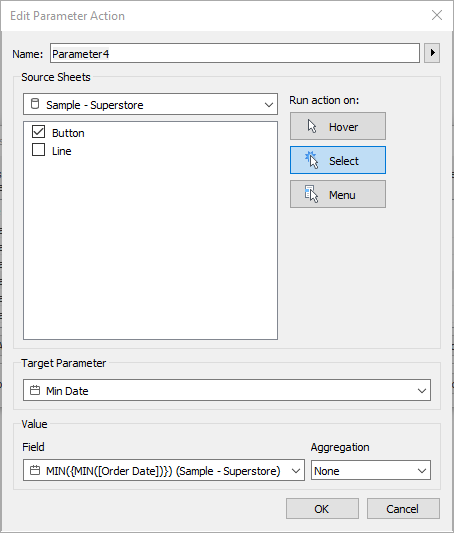
So we started down the path of parameters instead. I created a Min Date and Max Date:
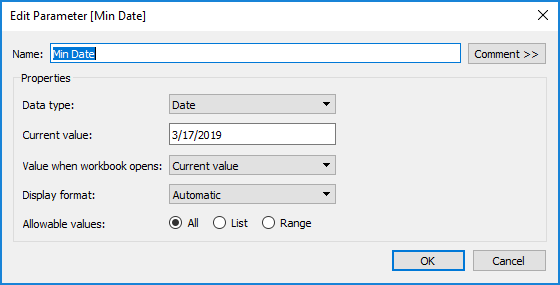
Just basic date parameters here, open to any value.
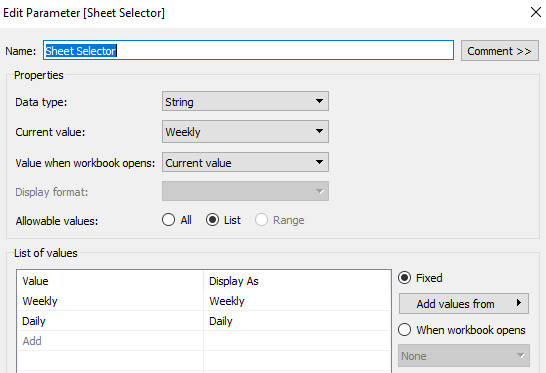
I will jump back now to point out that when I got the soon to be mentioned Parameter Actions working, switching between two sheets in a horizontal layout container, I noticed that the animations were not matching how Ann’s viz was transitioning. As we moved further into how to create a button (thinking, oh, there are buttons in dashboards now! nope…), we began to realize that the button was the 2nd sheet, and the weekly/daily shift was within one sheet. So, I already had a Sheet Selector parameter I created in order to switch sheets, so I just repurposed that:
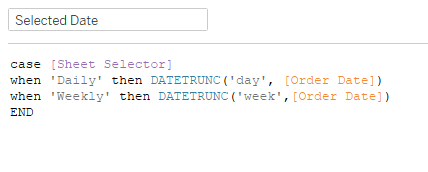
Then I created a date field to truncate the date on day or week based on the parameter value:
I added that to columns, at the DAY level, and created a duplicate field so I could format the tooltip date value different. Then I replaced the aforementioned custom date with this duplicated date.
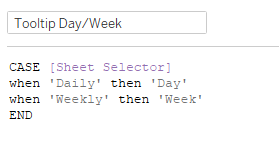
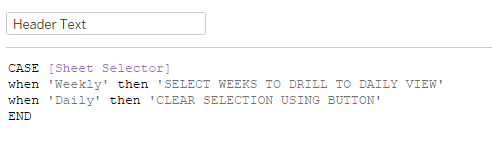
I also realized I needed to call out Day vs Week in the tooltip, so created a little case calc for that:
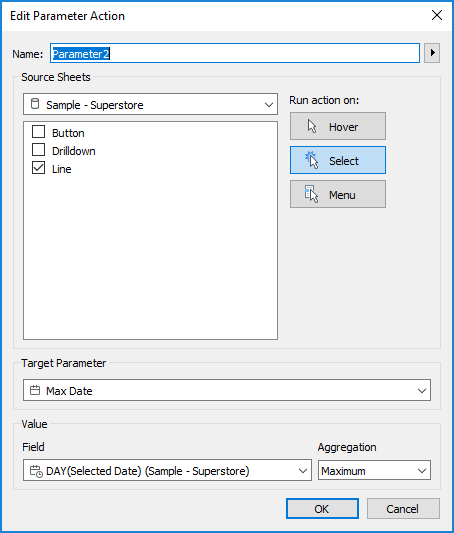
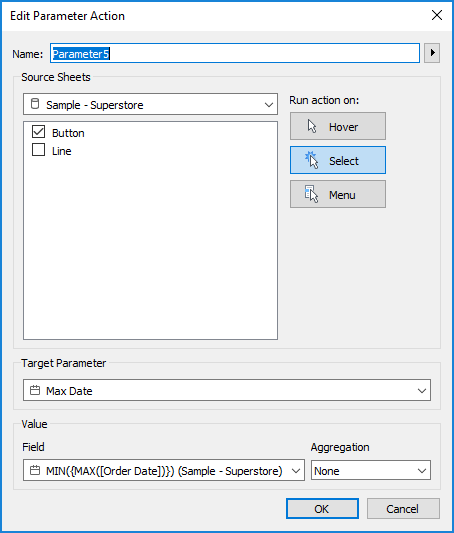
Now, back to the Min Date/Max Date parameters. I needed to get these to dynamically set based on the selected dates, so I created two parameter actions, one for each, which populated the parameter with the Minimum or Maximum Selected Date:

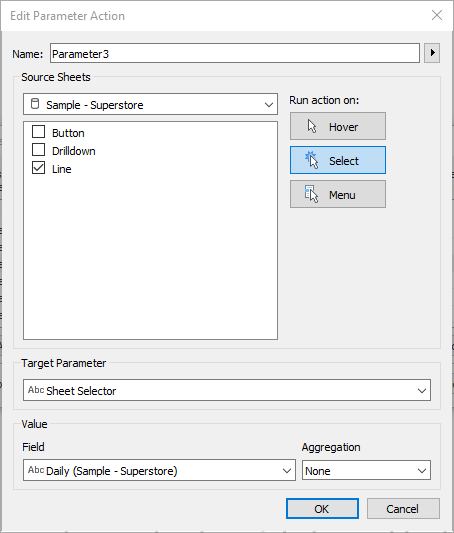
I also needed to change the Sheet Selector value from Weekly to Daily. So I created a Daily calculation with ‘Daily’ and added it to the Detail in the Marks shelf. That gave me what I needed to update the parameter value:
I had created a calculated field called Sheet Selector Filter that contained the Sheet Selector parameter, but when I didn’t need to use it as a filter anymore I just dropped it onto Color so I could set the Weekly gray and Daily purple.
Now that I had it switching from Weekly to Daily, I needed to create the button to switch back to weekly. Based on previous challenges, I went with a Gantt Bar, with MIN(1) on columns, and MIN(-1) on Size, which gave me a bar from 0 to 1. I fixed the axis on 0 to 1, and adjusted the height of the bar by dragging the top of the axis down. I’m realizing now I could have also adjusted the Size slider, so that’s another option. To get the label, I just double clicked on the Marks shelf and added ‘CLEAR SELECTION’ then dragged to label. On the label I center aligned, white Tableau Bold 12 font, 73% opacity. Why 73%? I have no idea, it just looked about right. Totally eyeballed it.
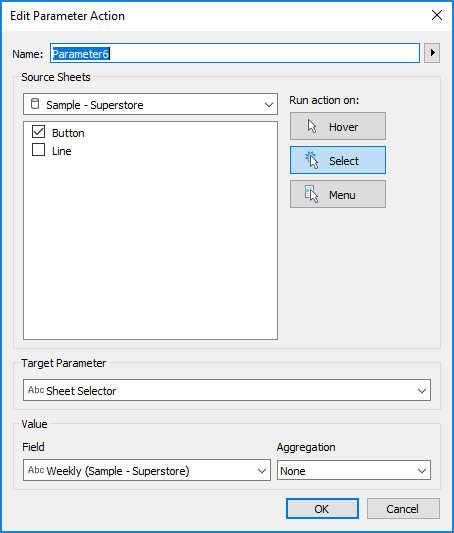
Now in order to make the Sheet Selector value change back to weekly, I needed a Weekly calc just like my Daily one (literally just ‘Weekly’ in the calc). Place that on detail. Then I can create that action:
Now I needed to update my Min/Max date to be the overall Min/Max of the 52 weeks (which Ann said we could hard code, so I did…). LODs to the rescue! Apparently I was near the end, as I didn’t create calcs, just edited in shelf. So I did {MIN(Order Date)} and {MAX(Order Date)}, and I needed to add my Order Date filter to the Context. Once I had those in the detail shelf, I could use them to “reset” the parameters:
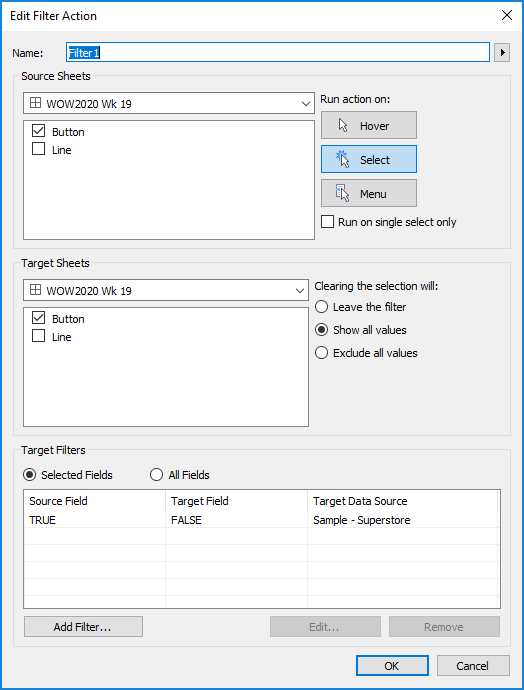
As I tested the actions, I noticed that I had to click on the Clear Selection button twice in order for it to clear. So I added TRUE and FALSE to the Detail, and added the filter action to automatically deselect:
I also needed the button to only appear when the Sheet Selector parameter was on Daily. So I dropped my Sheet Selector Filter onto Filters and selected Daily so it appeared and disappeared based on that parameter. I added it to the dashboard as a floating object in the top right of the view.
Similar to needing to click the button twice, I noticed that the weekly dates I was selecting were highlighted still in the daily view:
I tried the TRUE/FALSE deselect on there as well, but couldn’t get it to go away. :o( This is the one visual aspect where I did not match Ann, which probably has to do with my using parameters instead of sets for the date selection.
For the header, I needed the dynamic purple text:
Then I created the title of the worksheet:
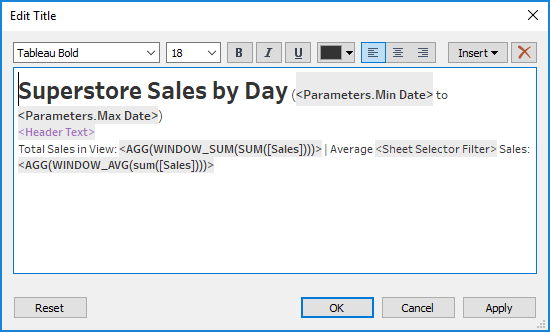
You’ll notice a couple WINDOW calcs there. I just added them directly to the Detail.
And we’re done!