I don’t know what it was about Ann’s challenge today that made it so difficult, but I S-T-R-U-G-G-L-E-D. I changed course multiple times, spent 20 minutes just trying to figure out a course of action in the first place, and thankfully got some ideas/assistance from the people in the room (all of this happens while I’m sharing my screen with several colleagues).
My first struggle was just figuring out the general layout. Ann’s hint to not use Measure Names/Measure Values just obliterated every idea I had initially of how to get these rectangles. And that was likely my problem, I thought of them as rectangles. (More on this later)
Since I was struggling with the layout so much I finally just decided that I would need the performance comparison calc, so I just as well create it. My initial thought was to do SUM([Sales])/LOOKUP(SUM([Sales]),-1), and that totally worked fine throughout the entire building process, until I got to the tooltips late in the game and realized I was going to make life difficult for myself. That’s when Yu Dong piped up and said she just created a current month and prior month calc based on a parameter. So much cleaner, no need for table calcs, creating indexes to hid the prior month, etc. So the rest of this walkthrough will incorporate that process.
So, to identify our current/prior month (and allow for someone to change the dates, per Ann’s requirements), we start with a basic date parameter:

Current value here is 11/1/2019 because Ann’s viz was based on November.
(Sidenote: You can tell how ready to be done I was at this point, after having built everything but the tooltips and needing to “start over”, I didn’t even name the parameter. Always name your parameters and calcs, kids!)
Now we need to identify the current and prior month. Current month just compared the parameter value with the first day of the month of Order Date:

Prior month does the same thing, just comparing the month prior:
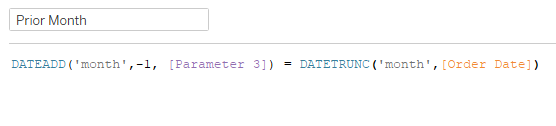
Then, in order to filter the view to these two months, just need a quick combination calc to drop on the filter:
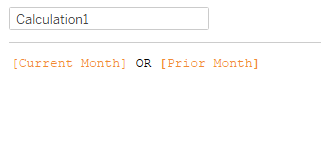
(Yep, another unnamed calc, it was bad)
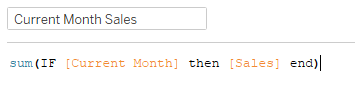
Now that we have the current/prior month, we need the measures. This is another one Yu helped me clean up. I usually lean to something like IF min(Current Month) then SUM(Sales) END kind of thing, but it wasn’t really working with my boolean Current Month calc. So this is where we landed, with the aggregation outside of the IF statement:


Prior month calcs were the same, just with Prior Month in place of Current Month. Then for the performance comparison, just Current over Prior:

With all of the metrics complete, had to figure out how to get the aforementioned rectangles. Somewhere in the 20 minutes of stupor, I finally just had to download Ann’s workbook to get an idea of how she went about it. One look, and I realized they weren’t rectangles, they were bars. Once I had that insight, I jumped back into my workbook, threw some min(1)’s onto the columns shelf, and had myself some bars.
To get the color, I created a calc for each metric to check if the performance comparison was greater than 100% and set the color accordingly:

With each of the colors in place, I needed to figure out the KPI label. Since I was already identifying if current month was greater than prior in the color calcs, I plugged those in:
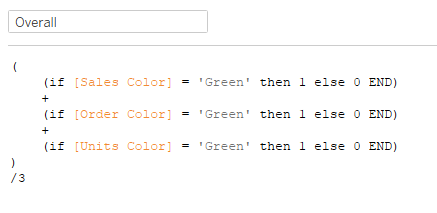
That gave me the proper percentages, but I needed to get the red indicator. At first I tried to incorporate it with the Overall value calc, but decided against that. I ended up copying a bullet point and throwing it in a calc:
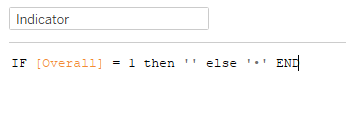
Then I changed the mark type to text, and added Indicator and Overall to the label:

When I got to the tooltips, I realized I needed to get the month name for the current and prior month for the labels:
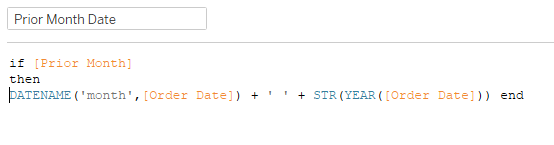
Finish up the tooltips and formatting, and we’re all set!

Click here to view the workbook in Tableau Public.