This week’s challenge by Ivett involved dynamic labeling of a heatmap. This week had a basic and advanced challenge. After figuring out the basic version pretty quick, my methods for the solution had to change in order to accomplish the advanced solution.
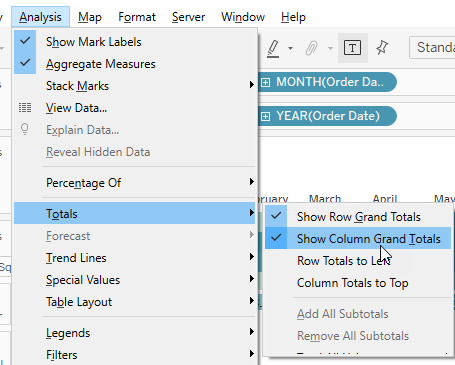
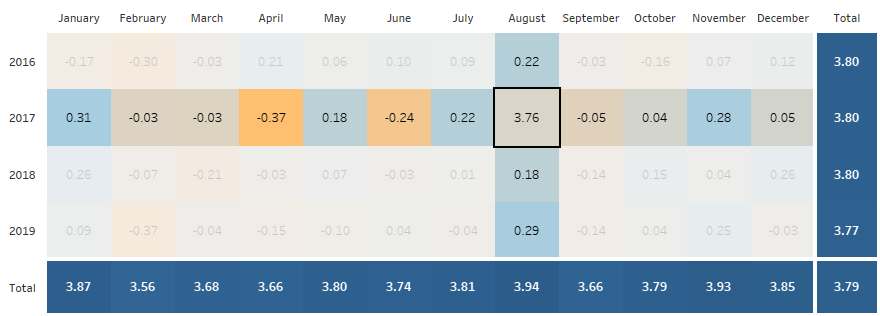
I started out with MONTH(Order Date) on Columns and YEAR(Order Date) on Rows. Add AVG(Quantity) to Color, and you have a heatmap! In order to add the totals, you head to the Analysis menu:
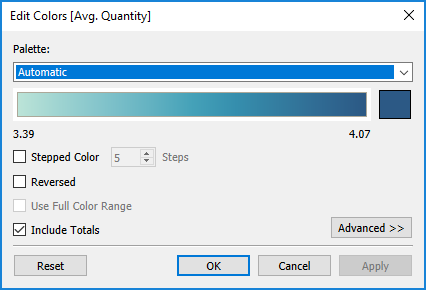
When you do that, though, the totals don’t incorporate with the colors right away. But if you click on Color, and Edit Colors…, there’s a check box there to include totals:
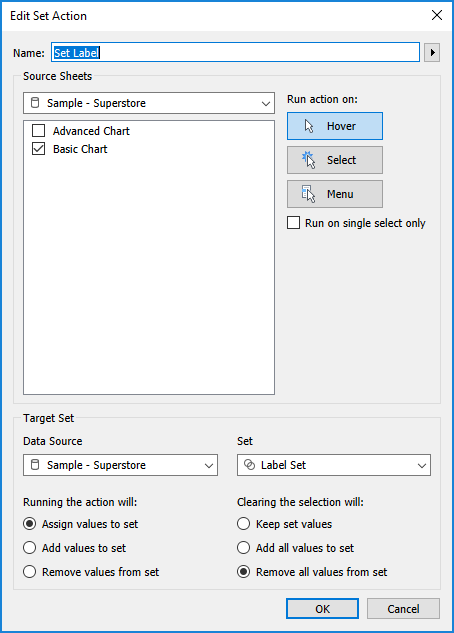
Now for the labels. From looking at the workbook, I decided I would need to use a set action for the hover label, and a conditional to get the labels to always show on the totals. Ivett was kind enough to give a hint to use Size(), which was really handy. I right clicked on a cell and Create Set, and created the Label Set which had Month and Year in it. Then I created the Set Action to set the value based on where you hover:
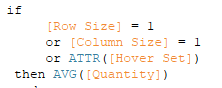
Then I created a calc to display the quantity if the cell is in the Label Set:
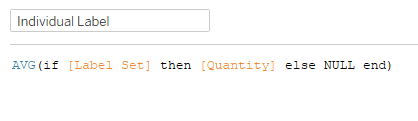
I put AVG around the IF statement so I didn’t have to worry about aggregating the Label Set (the ol’ “can’t mix aggregate and non-aggregate” issue)
Next was the overall label that incorporates size. I played around with Size on the label to see how things worked. I found when I calculated size based on Month and Year, it looked like this:
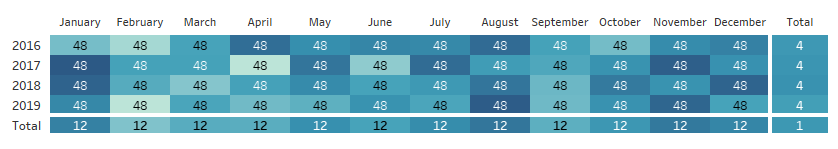
So I used that to create the label calc:
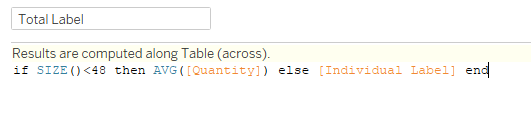
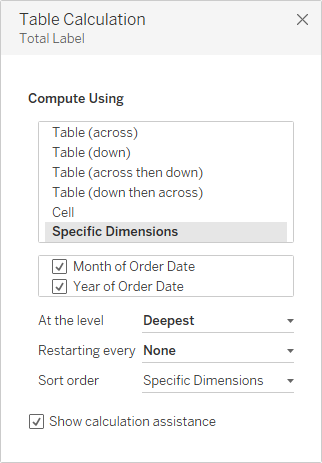
If the size is less than 48 (the totals sections), give me the AVG(Quantity), otherwise return the Individual Label. Add this to label, and Edit table calculation:
I also noted the additional space dividing the totals, so I went to Format Borders, and changed the Grand Total/Pane thickness and color.
That finishes up the Basic challenge.
For the advanced piece, I tried to pick up where I left off with the Basic, but eventually found that I needed to change a few things in the way I set it up. The first thing I did was change the dates in Columns/Rows to custom dates.

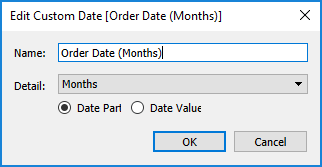
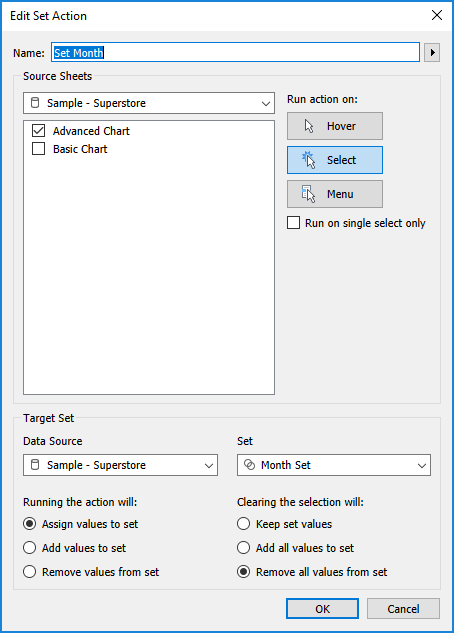
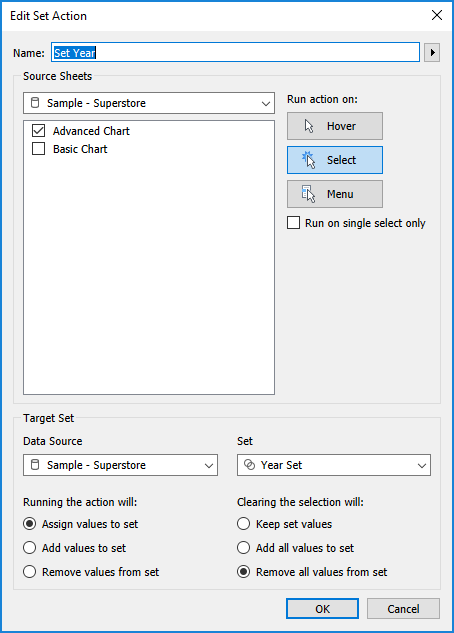
This was necessary to get the sets to work the way they needed to. So then I created a set for for the months and years (Month Set and Year Set). I figured I would need a set action to run on Select to get the labels to appear on the whole heatmap.
My previous label calculation using the overall size wasn’t able to work with the additional label requirements upon clicking. But, although I got really close a few times, I just couldn’t quite figure it out. A peek at Ivett’s workbook pointed to looking at size by row and column, instead of overall. So I created a Row Size and Column Size calc with SIZE(). Then when you use those and calculate the Rows – Table(Across) and the Columns – Table(Down), the totals end up with a value of 1. That makes those usable for making the total labels always show.
In order to keep the hover label, I needed a new set with my new date fields (Hover Set) and the accompanying set action.
That gives me what I need to cover the labels from the basic challenge:
The same peek at Ivett’s workbook showed the creation of a Selected Value, which allows it to be used in calculating the difference of each month from the selected value.
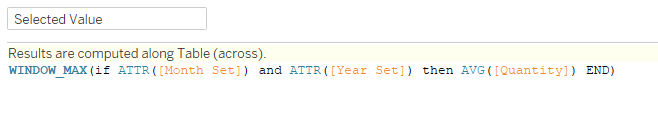
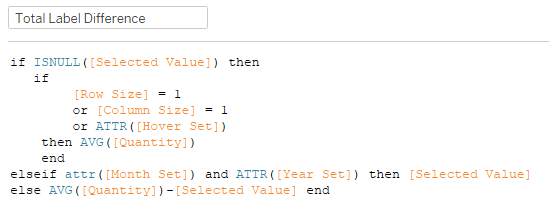
Then I can add the selected value and the remaining difference values to the label calc:
![]()
If the Month and Year Set are true, return the Selected Value. Otherwise, return the difference between AVG(Quantity) of the cell and the Selected Value.
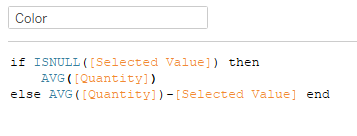
Now my only problem was getting these values to only show up when I clicked on something. I settled on starting the IF statement with ISNULL(Selected Value), which should only have a value if a cell has been clicked. So that final calc is:
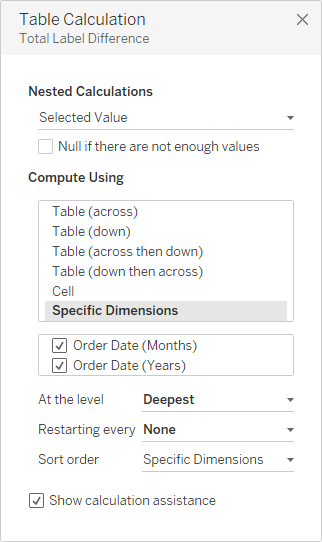
After you add it to Text, you have to edit the table calc to run on Specific Dimensions:
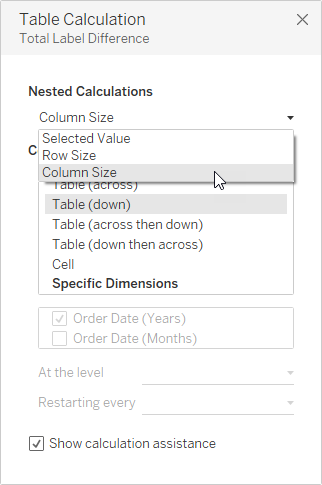
Making sure to also adjust the Column Size calc:
The Color calc was a bit simpler, because I need it to either show the AVG(Quantity) or the difference from the Selected Value:
The last thing I need is the highlighting of the Month and Year values upon selection. Couldn’t figure this one out, either, but it was rather simple. Just needed a calc to identify the Month or Year set:
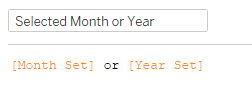
Then add it to detail (with MAX), and you can add a Highlight Action on the dashboard:
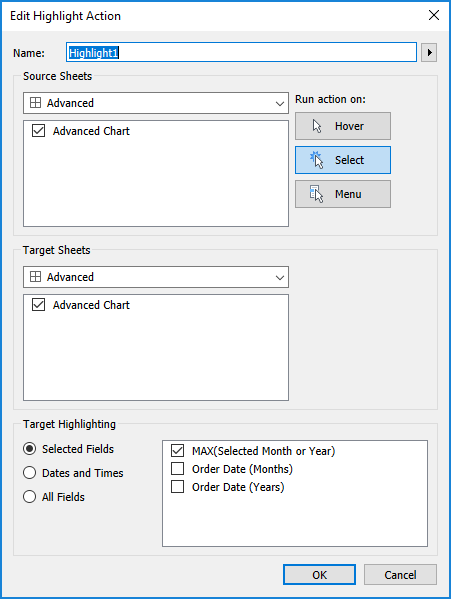
And we’re in business!
Once I finished, I played around with adding indicators like Rosario Gauna did, but was kind of fried by that point to figure out the additional calcs. I bounced around so many things, changing and adjusting to figure things out, I feel like this was all over the place. I hope it was some help.