Lorna‘s challenge this week was a head banger. Like I felt like I was trying to bang my head through a wall for most of it, brute forcing (or at least attempting to) my calcs to do what I wanted them to do. All the while Tableau just kept laughing in my face and saying “all fields in an LOD have to be from the same data source, dummy.” “Didn’t you listen last time? Just because you put them in a sub-calc doesn’t make the LOD work any better. Maybe you should try something else?” “Glutton for punishment, eh? Well, I just leave that error right here…”
Anyway, today was a great reminder of what life was like before cross-database joins and LODs, and that those ways are still available and work just fine. Throw that all on top of the humble pie I get by struggling my way through things with colleagues watching (and recording it).
***SIDENOTE: 4 months into this experiment of doing Workout Wednesday live with Ancestry colleagues as a training exercise, this is one of the best projects I’ve ever chosen to do. It’s a dedicated hour (or two today…) to work on it. It helps them see how to build some cool things, and see the step by step for it. It also makes me explain what I’m doing and why (which actually comes in handy for this blog). And it also reminds me (in a public setting), week in and week out, that there’s a lot I still don’t know about Tableau. Even after 5 years, there is always (tons) more to learn. ***
On to the challenge. I connected to the data (two sources) and created the relationship on MY:
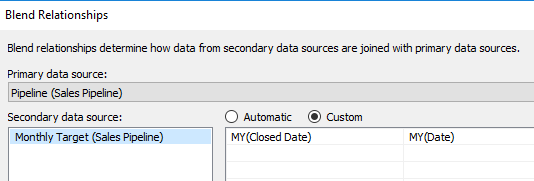
Then I added MONTH(Closed Date) to columns, pulled SUM(Sales) to rows, and SUM(Target) to the dual axis. I made the Target a Gantt bar, and I had the basic structure for things. I grouped the Stage field so that Negotiating and Proposing were ‘Pipeline’, and filtered ‘Closed Lost’ from the view. Then I created a Closed Won calc to give me sales only for Closed Won:

Then I did the same for Pipeline:

Added those two to the SUM(Sales) axis which gave me Measure Values, and then I dropped SUM(Sales). (Obviously, I could’ve skipped SUM(Sales) completely, but I like to get a basic structure of things and then work through the calcs I need)
Now to find the difference between Jan-Mar sales and their targets. Through the events of the challenge, I realized I wanted to sum the target values for Jan-Mar in the Monthly Target data source:

(Name your calcs, kids…unless you’re at the end of your rope because you’ve been playing with calcs for thirty minutes and you’re just trying something to see if it will work…)
Then I created a Monthly Sales calc to only give me Closed Won Sales through Mar:

Now with both of those calcs I can find the difference:

Now comes the point where I kept trying to trick Tableau into letting me use an LOD calc. I have gotten so comfortable using LODs over the years that I probably use them more than I should. Today that was very evident. I had a Target Diff, and I needed the FIXED Sum of that, but Tableau wouldn’t let me, no matter how hard I tried. Finally, after about 30 minutes of getting mad at the calc window, I think I remembered one of Luke’s challenges earlier this year that required a WINDOW_ calc. Lightbulb!

Just like that, without and LOD, I had a way to sum the values for Jan-Mar and divide them across the remaining 9 months. So easy, if not for spending 30 minutes trying to shove the square peg in the round hole.
Then the missing pipeline was quick:

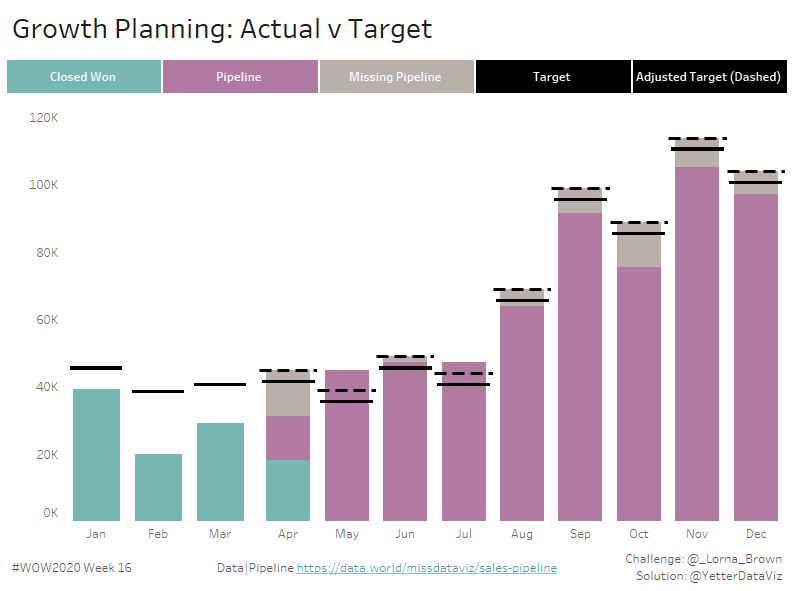
So I added Missing Pipeline to the Measure Values, but I needed to figure out how to get the adjusted target line into the view. I noticed initially when I looked at the Tableau Public version that Lorna used a reference line, because it didn’t highlight the same way as all of the other bars/lines in the view. But there wasn’t a way I could see to get the Adjusted Target into the view to be able to use for a reference line. I finally settled on the SUM of the Measure Values, and that got it to work:
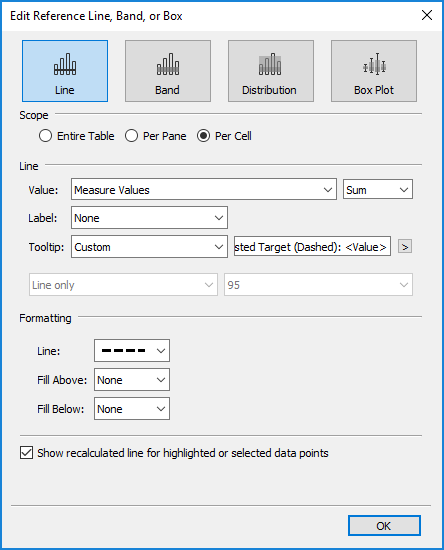
Great, almost there! Wait…Lorna’s view doesn’t have the Adjusted Target on Jan-Mar. How do I get rid of those? Surely this was the way it had to be done? Then right as someone was saying “did she use two sheets?” I noticed this:
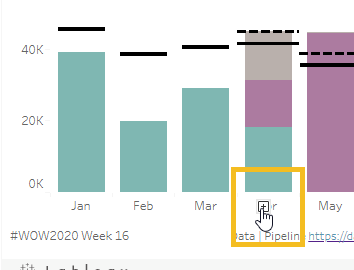
That’s the plus that shows up on the FAR LEFT of a date axis. Of course, hence “3 or less” on the sheets requirement. So I duplicated my sheet, hid Apr-Dec on the first, and hid Jan-Mar on the second. Why hide instead of filter? Well, I need the values from Jan-Mar in the view in order for my WINDOW_SUM to work. If I filter those months out, my WINDOW_SUM won’t have any Closed Won sales to sum.
Initially I had made my Missing Pipeline an IF > 0 then Missing Pipeline else 0…but that made my Adjusted Target not work. But without it, it showing Missing Pipeline as negative for a couple months. So I fixed the axis to start at 0:
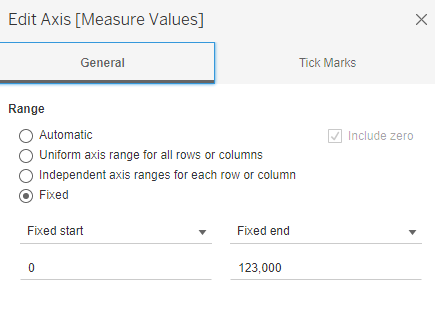
I also had to fix the end of the axis, since without that, the Jan-Mar bars were way higher than they should be in relation to the other months. I picked 123K because that made the 120K tick mark show up like it did in Lorna’s.
My target lines weren’t as thick as Lorna’s, but I remembered seeing her #TableauTipTuesday from yesterday, so I gave that a watch and added AVG(1000) to my Gantt marks card. (I settled on 1000 after a lot of playing around and going back and forth to the dashboard)
To get the tooltips, I needed a couple more calcs for the Closed Won and Missing Pipeline. Closed Won had null values for May-Dec, so in order to show 0, I needed a ZN:

Then the previously mentioned Missing Pipeline needed to show 0 like I originally planned instead of the negative number:

Now all I need is the legend. I figured it was some sort of Gantt using the Measure Names, so I just started dragging stuff around and adding MIN(1) in different places until I got it to work. Finally ended up here:

Not shown is the MIN(1) axis fixed from 1 to 2 (since 1 on size added to 1 on the axis goes to 2). Changed the Column borders to be white and a little thicker, edited the Measure Names aliases, and we’re all set! I did notice that Lorna’s weren’t highlighting when you hovered, so I stuck a floating Blank on top of the legend in the dashboard to do the same.
And with that, after probably an extra 45 minutes than what I should’ve needed had I not tried to brute force my LODs, we’re finished!
A head banger indeed – you’d think with so many of use hitting our heads against the same wall at the same time Tableau would have caved in, but no – it stood firm!
Nice explanation and always good to see the different ways people get around the problem. Thanks for taking the time to share it.
You would think, right?? I was similarly befuddled when Lorna told me she didn’t use table calcs…I swore I tried something like she did and it didn’t work, but I realized I may have just gone straight to LODs then table calcs without actually trying otherwise.
Glad you enjoyed. Thanks for reading.