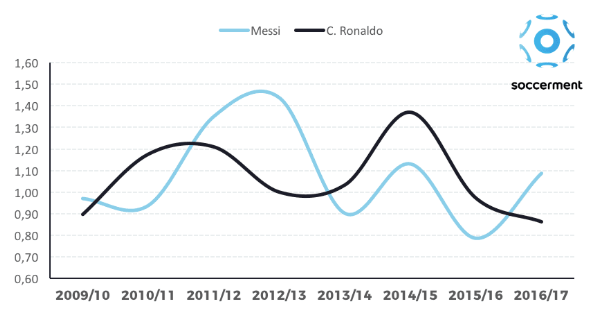
This week’s Makover Monday looked at goals per game by Lionel Messi and Cristiano Ronaldo:
What I like:
- Clear legends/axis labels
What could be improved:
- Rounded lines make it difficult to identify where the actual points are
- I.Don’t.Like.Grid.Lines
What I built:

Although these two players are known most for their goal scoring, when I looked at the dataset I wanted to look additionally at assists and how many games they played. But now I have five metrics (games, goals, assists, goals/game, assists/game) that I want to look at, but don’t want to clutter things. So I pretty quickly thought of Lindsey Poulter‘s Choose a Metric view in her Set Actions workbook. Once I got everything built I played around with the layout a bit, and finally settled on putting the metrics across the top rather than down the side, which allowed the large chart to be shorter/wider than a square. For me, seeing the assists in addition to the goals actually makes me lean more toward Messi as he’s been more productive overall. This thought helped cement the idea of showing the additional metrics in my mind.