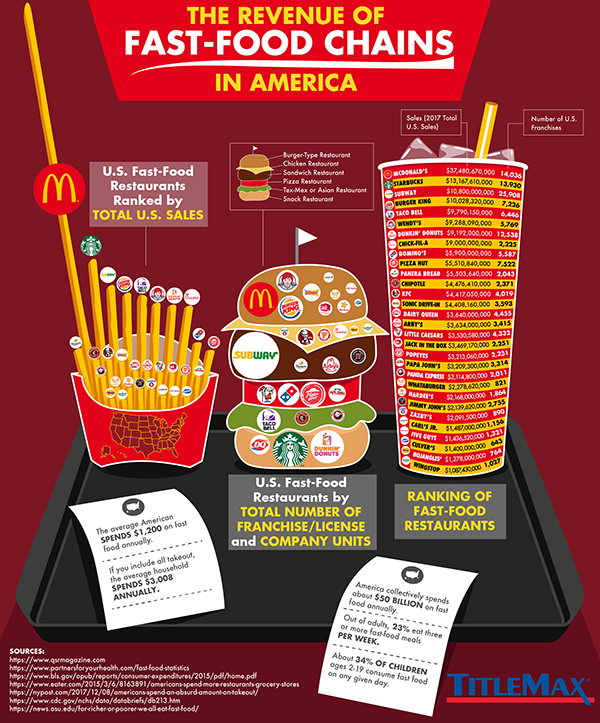
Makeover Monday this week looked at a Fast Food Chain Revenue viz from Title Max.
What I like:
- Easy to see how much more revenue McDonald’s has than the rest
- Interesting combination of menu items as the viz
What could improve:
- Logos hard to read on the location burger, especially if they’re logos you’re unfamiliar with due to primary geographic region
- Why combine Tex-Mex and Asian group, other than ran out of space?
- Very busy across the board
As I dug into the data, I looked at restaurant types (burgers, chicken, pizza, etc), thought about practicing some set actions to expand the restaurant type to show each of the individual restaurants from that category, and looked at a scatterplot of sales revenue and location count. None of those really spoke to me.
After about 20 minutes, I realized I could do sales by location (not sure why it took me that long), and that popped out a really interesting point, which became the focal point for my final viz.
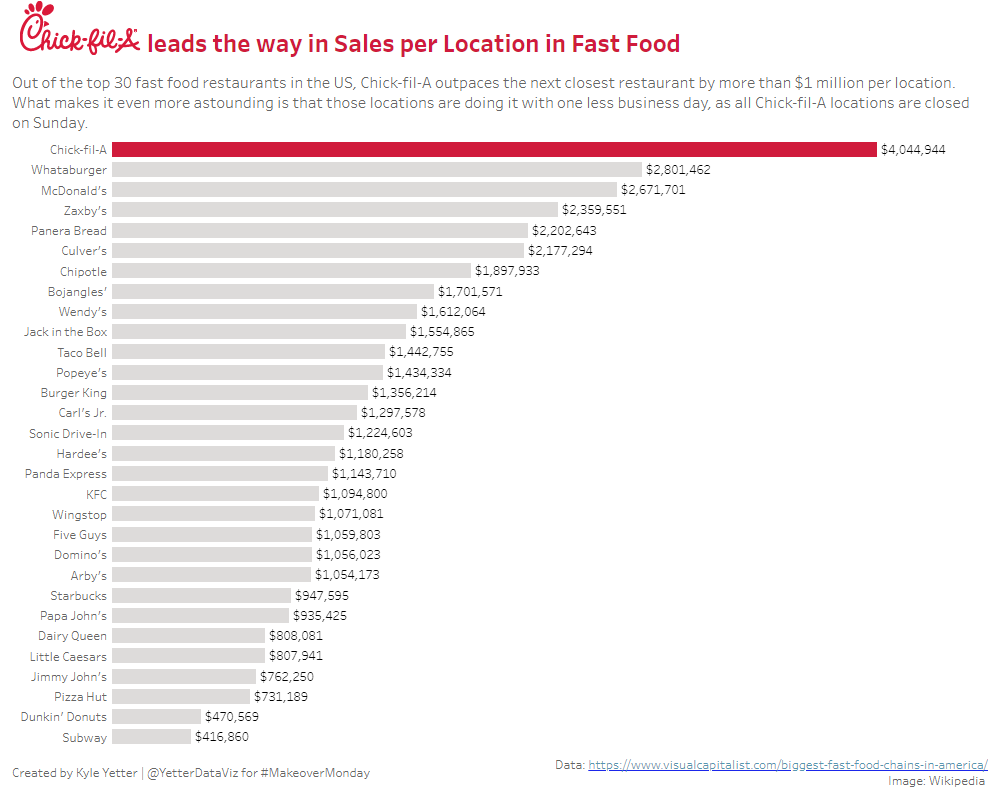
On a per location basis, Chick-fil-A brings in over $4M per store, more than $1M more than the next closest chain. It’s almost 10X what Subway brings in per store! And then I had the additional realization, that Chick-fil-A only opens 6 days a week. They’re doing that with roughly 50 fewer business days in the year. Incredible.
Since Chick-fil-A was the story, I grabbed the red from the logo, and made that bar the only one with color to focus the attention there, trying to follow principles I’ve learned from Cole Knaflic‘s book, Storytelling with Data. Kept it pretty basic this week, but it was a pretty basic dataset.