This week’s challenge from Sean was a focused one. Like many others, I often jump to Fixed LODs to solve my calculation needs. This week’s challenge forced me to NOT use Fixed.
The first thing I did was add Sub-Category to Rows. Then created a calc to include the Manufacturer:
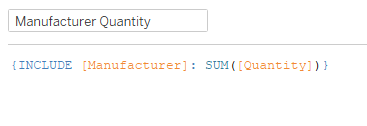
Include adds the manufacturer into the mix, summing the quantity at the level of Manufacturer AND Sub-Category. Then we can take the AVG of those manufacturer quantities for each Sub-Category. That got me the same quantities for each Sub-Category as Sean’s view. Next I needed a way to highlight the selected Sub-Category. First I tried a Set, thinking Set Action would work to select. Later on, though, I decided a Parameter would be better. So I created a parameter:
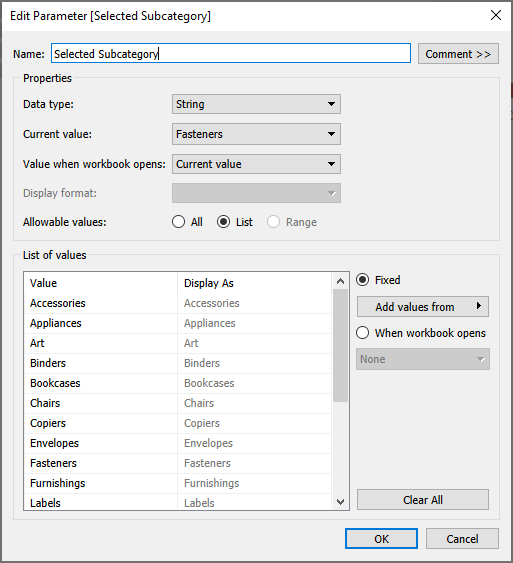
I added values from Sub-Category (even though that probably wasn’t totally necessary, since I would be passing the value through a Parameter Action). Then I created the action:
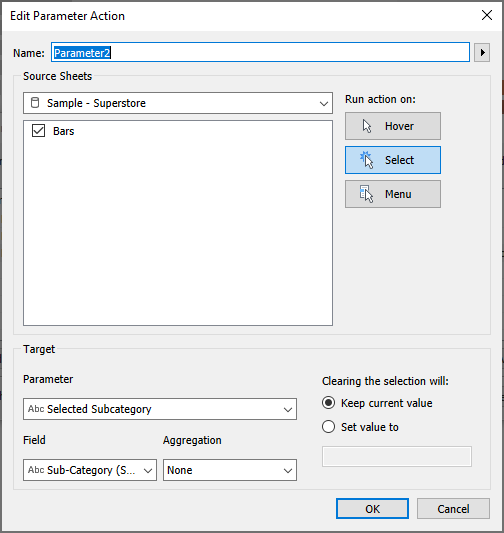
Next I created a calc to check if the Sub-Category matches the parameter value:
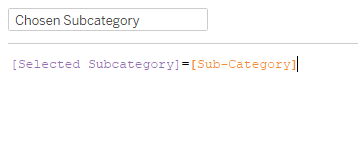
Then I added that to Color and matched them to Sean’s teal and gray.
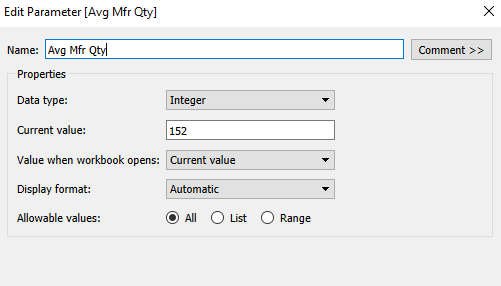
For the variance, I decided to use another parameter action to pass the average units into a parameter value that I could then use to compare the other Sub-Categories to. So first, I created the parameter:
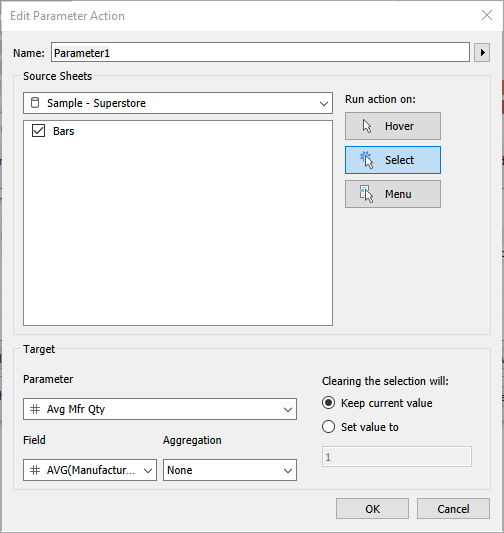
Then the parameter action:
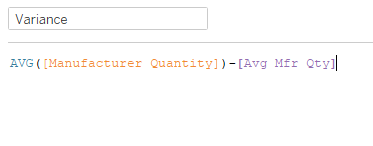
With the parameter value in place, I can calculate the variance:
Add it to Columns and Color, and we’ve got the bar charts setup. That left some formatting to match up, turning off gridlines, axis rulers, tick marks, and zero lines. It took me a minute to figure out how Sean got a zero line on the variance chart, but not the quantity chart. So I decided to try adding a constant line to the Variance axis:
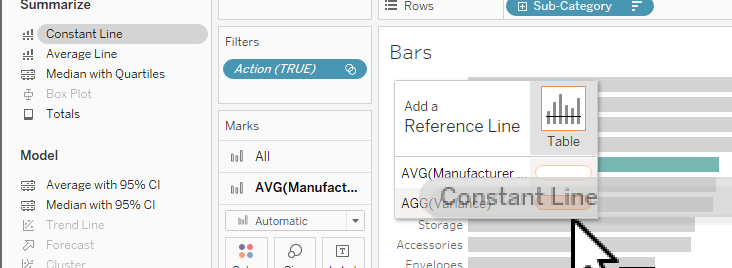
Then I formatted it like a zero line, and it worked!
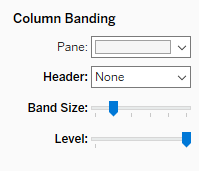
Adding the gray shading to the variance chart was some column banding, but only the pane, not the header:
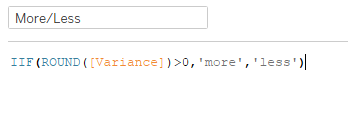
Last thing after the formatting was the tooltip. I needed a calc to show more/less:
I also needed to get an absolute value of the variance so there’s not a ‘-‘ in front of the negative variances.
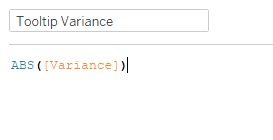
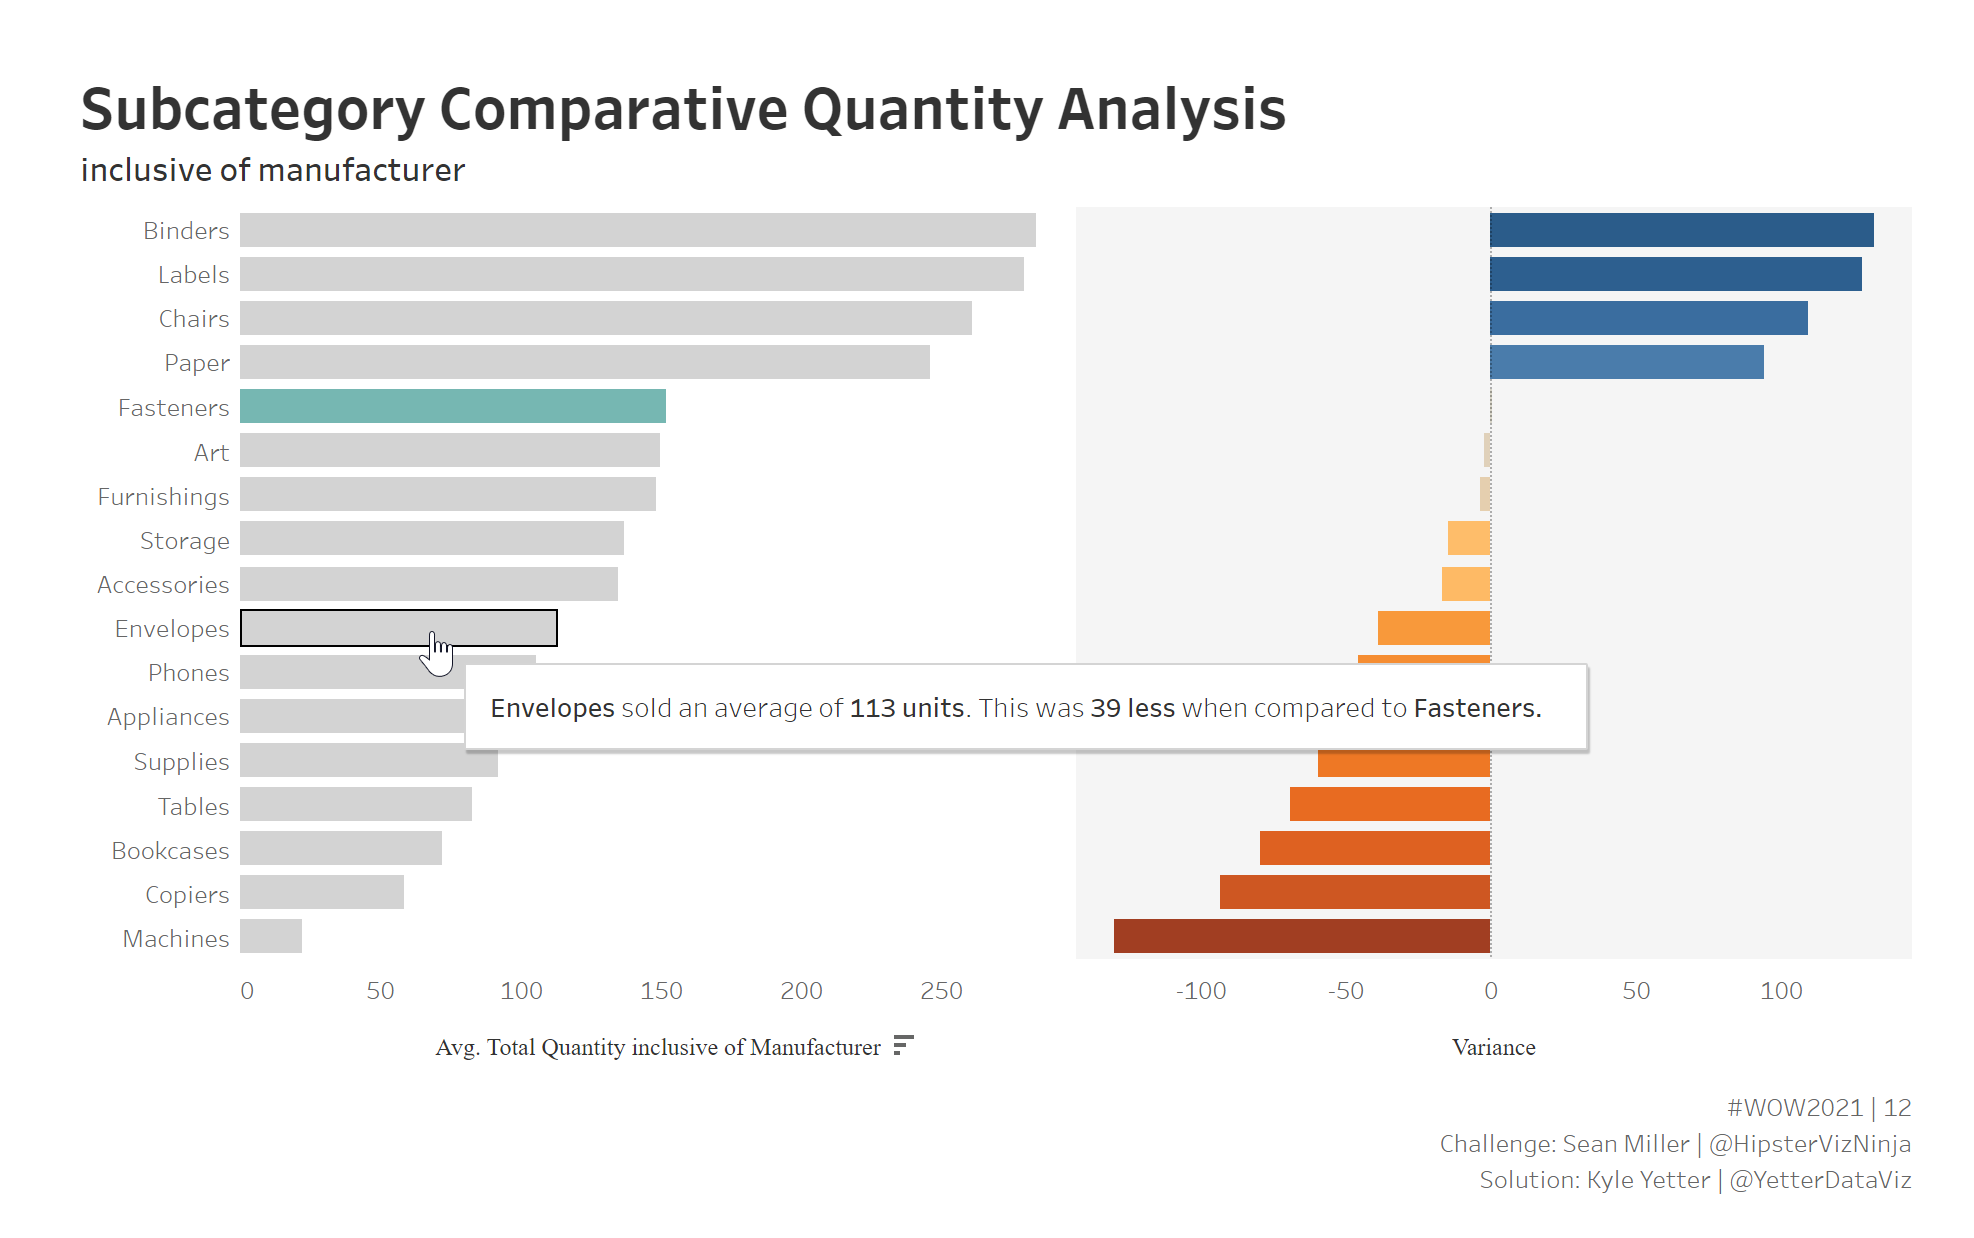
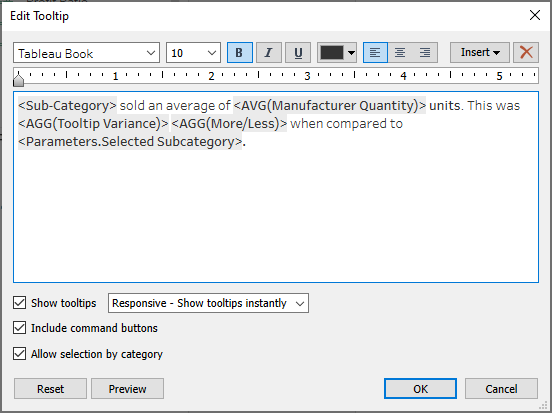
The final tooltip looks like this:
Drop it in the dashboard with the title, and we’re done! It was really good to think about other ways to do things without defaulting to the Fixed LOD.