Making waves with Fourier Series, Part 1
This is the first entry in this series
Making waves with Fourier Series, Part 1
As you will have seen from some of my previous posts and dashboards, I rather like combining maths and Tableau. That was the main motivation form the 3d rotating cube.
This time I was inspired by a video about visualising how Fourier Series work by Destin Sandin on his Smarter Every Day channel.
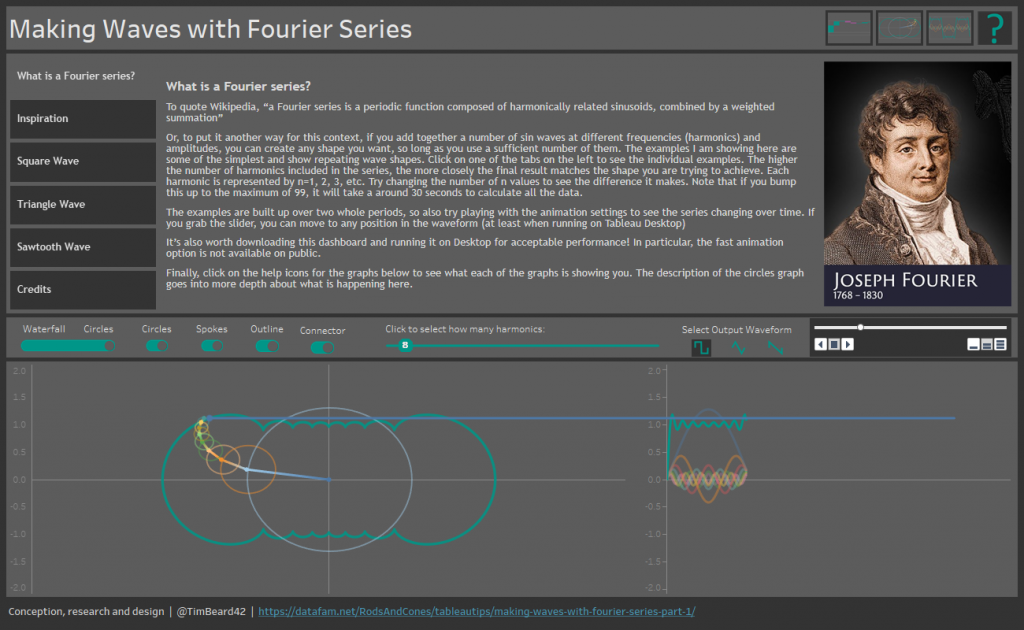
Click on the screenshot below to open up the dashboard. If you have Tableau desktop, I very, VERY strongly suggest that you download the dashboard as the support of animations through pages is poorly supported and very slow on Tableau Public.
I usually blog my journey whilst building a dashboard, but I’ll save us both from the pain this time. Too many wrong turns as well as clicking and hoping for that to be much fun. I’ll therefore stick to a description of what I ended up with.
This will be a series of blogs covering the various parts of the build and I won’t start with what a Fourier series is as you can find that out from the dashboard itself!
I’ll start instead with something that surprised me how difficult it was. The tabbed text boxes at the top of the dashboard.
The requirements were as below:
- Text blocks to be swappable using tabs
- Support, e.g., pop & swap such that only one text/image block is displayed at the same time
- Support combination of text and images
- Texts must line up, wrap and be spaced correctly or at least consistently
- Images must not be too pixelated
- Long texts
- Ability to add active URLS that the user can click
The various options I went through were:
- Text block in dashboard
- Simple sheet with a text field and long label text
- Multiple dummies (e.g. MIN(1)), each with a text label or image (shape)
- Simple sheet with annotation
- Text and image saved as a combined image file
- Link to publicly hosted webpage containing text, images and URLs
I’ve created an extra sheet in the workbook to detail the limitations of each option and have duplicated it below (sorry for the crappy layout – that’s WordPress!):
Implementation Options | Text blocks to be swappable using tabs | Support, e.g., pop & swap such that only one text/image block is displayed at the same time | Support combination of text and images | Texts must line up, wrap and be spaced correctly or at least consistently | Images must not be too pixelated | Long texts | Ability to add active URLS that the user can click | Comment |
Text block in dashboard | No | No | No, but could use a container | Yes | Yes, with container | Yes | Yes, but URL must be written out |
|
Simple sheet with a text field and long label text | Yes | Yes | No | Yes | No | No | No | Text length limit was a nasty surprise |
Multiple dummies (e.g. MIN(1)), each with a text label or image (shape) | Yes | Yes | Yes | Yes, but very fiddly | No | Yes, by having several dummy fields | No | Poor resolution of Shape Files is a known issue |
Simple sheet with annotation | No | No | Yes | Yes | No | Yes | No | I thought this was my solution, but Annotations always stay visible, even when the sheet is filtered out |
Text and image saved as a combined image file | Yes | Yes | Yes | Yes | Yes | Yes | No | Feels like a crappy option with potentially poor readability. Editing is also a pain |
Link to publicly hosted webpage containing text, images and URLs | Yes | Yes | Yes | Yes | Yes | Yes | Yes | Requires access to hosting resources. Another benefit of having a blog!! Editing is a bit painful |
The solution I ended up with was publicly hosted web pages, which are hosted on this blog platform. Another benefit of writing a blog!
Should you want to be informed when I add to this series, feel free to subscribe to this blog and / or follow be on Twitter: @TimBeard42