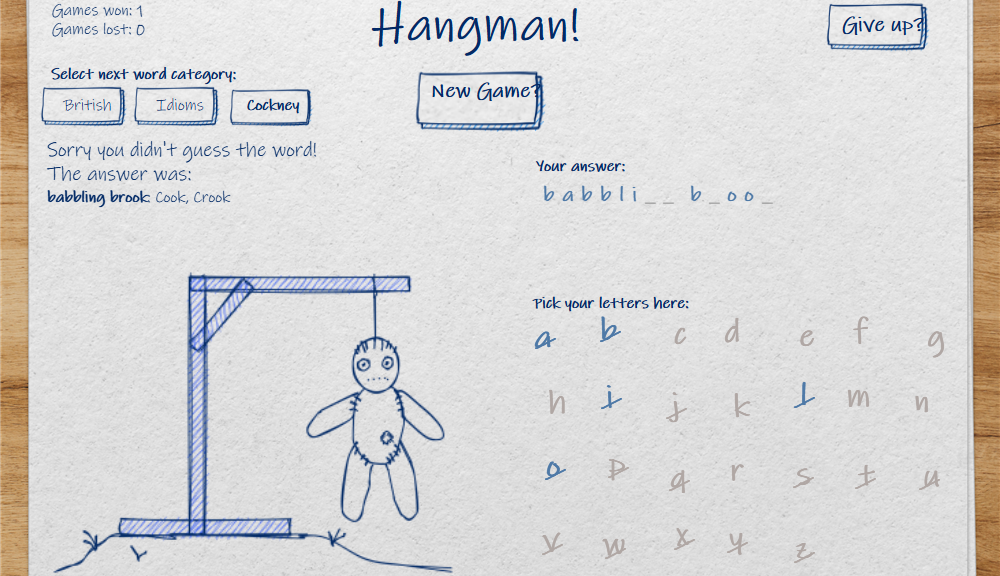
Browsed by
Tag: Densification

Hangman – IronQuest

Hangman – IronQuest

The theme of this month’s IronQuest was games. After my last couple of projects, I had promised myself not to spend too long on this one. I failed miserably! So this will be a story of failures and lessons learnt, plus some highlights of the final dashboard at the end. See the result here Lessons learnt, all about what you can’t do in Tableau Public: ● No access to APIs● No access to any live data● No way to programmatically…

Read More Read More

Perseverance – the Making of a Parachute

Perseverance – the Making of a Parachute

I was inspired to create this dashboard by the amazing videos of NASA’s Perseverance Rover surviving the “Seven Minutes of Terror” during it’s landing on Mars. If you saw it, you probably noticed that the parachute had a rather strange pattern on it. It turns out that that was one of many easter eggs included in the mission. The parachute encoded the Jet Propulsion Lab’s motto “Dare Mighty Things” along with the coordinates of the Lab itself. “Super nerdy”, I…

Read More Read More

WOW2020 Week 27: What is the distribution of total orders by customer?

WOW2020 Week 27: What is the distribution of total orders by customer?

A fun little challenge this week from Luke. It was one of those where if you hadn’t already worked with certain concepts, it would be really difficult, but not too bad if you had. Fortunately, I had and when I saw the challenge, I knew I wouldn’t have too much trouble (in principle!) It also had the benefit, that the difficulty was in the concept, so it’s pretty quick to build if you already know the techniques. In essence, this…

Read More Read More

WOW2020 Week 23: Can you excel at bar charts?

WOW2020 Week 23: Can you excel at bar charts?

Bar charts. Or are they? Requirements on the WOW websiteLuke’s solution on Tableau PublicMy solution on Tableau Public This week’s challenge from Luke looks at first blush to be a fool’s errand: why would you want to abuse lovely Tableau to create a chart that looks like an Excel chart? However, I’m sure, as ever, there’s more to this than meets the eye. Below are Luke’s chart and the standard equivalent in Tableau for comparison: Note that the Tableau bars…

Read More Read More

WOW2020 Week 22: Profitability spotlight – is your budget recovered?

WOW2020 Week 22: Profitability spotlight – is your budget recovered?

A challenge involving a new chart type, described as “a bi-dimensional chart (alternative parallel chart)”. Requirements on the WOW websiteIvett Kovács’s solution on Tableau Public My solution: The Journey The first challenge is working out what the chart is supposed to show and how to read it. Certainly not a chart type for the casual user, more something that succinctly shows information to regular users of the dashboard. The solution looks like this: If you understood that straight away, then…

Read More Read More