2020 Week 25: Can you add and remove items from a set?
Lorna’s challenge this week is all about the new set actions available in 2020.2 and was inspired by the training that Bethany recently gave on this topic. Fortunately, I attended this training, so I’m hoping not to have too many problems.
The key ability that has been added is being able to individually add or remove members from a set. Think of the old school yard scenario of two “captains” picking members in turn for their teams. Here there are potentially three sets, the two teams and the remaining, unpicked players (the set I was usually in at school!) This was a scenario that we simulated in Bethany’s training.
Lorna’s challenge on Workout Wednesday
Lorna’s solution on Tableau Public
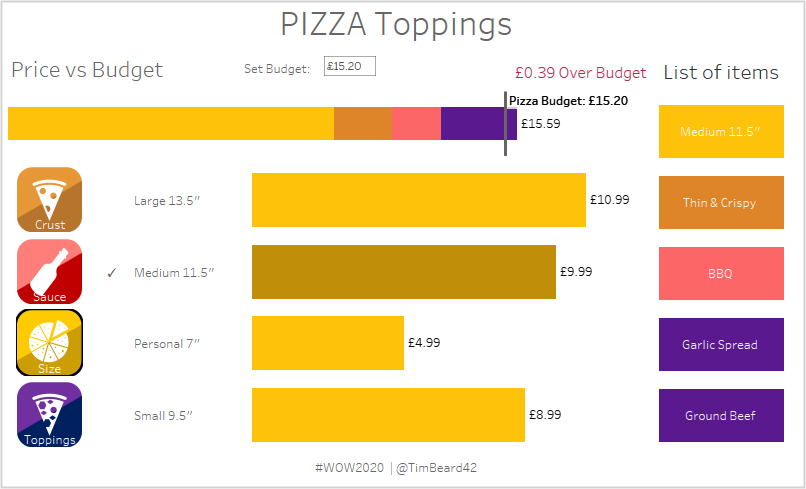
My solution:
Challenges
None this week – it all went pretty smoothly and to plan. Must be learning something!
Tips, Tricks and Techniques
● The new set actions, which were the main focus
● Adding custom shapes
● Adding two fields onto colours
● Duplicate Product field to correct display order of columns and rows
● Use of MIN(1) or similar as dummy heading. This trick is used all the time!
● Creating a parameter directly from the Reference Line dialog box
● Changing the display order in dual charts
● Colour coded text (e.g. black when in profit, red when not)
● Dummy field and highlight action to remove highlighting when selecting the ingredient category. Note that a different, two-field, technique is needed for area charts and maps. See this post from Luke Stanke
● Forcing a tooltip to be the width you need to avoid wrapping
The Journey
The scenario here is about picking ingredients and options for a pizza one by one and adding them or removing them from your shopping basket whilst comparing the total cost against a budget that you can set.
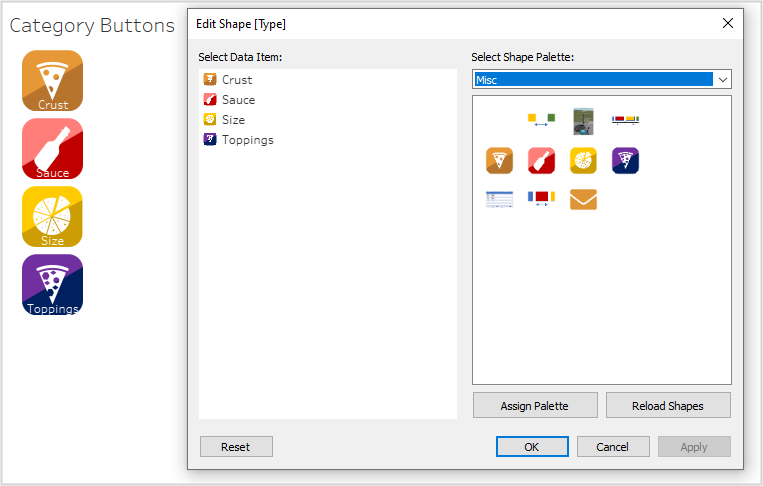
Lorna kindly made her icons available for the dashboard. These need to be saved in a shapes folder in the Tableau Repository. I have a folder called “Misc” for such things that I don’t expect to use very often.
Creating the sheet to select the ingredients category selection buttons was just a case of dragging Type to Rows and Label, selecting mark type as Shape, then dragging Type to Shape too. Then click on the Shape icon to select shapes for each category. It may be necessary to click on the Reload Shapes button:
After removing the headings and some formatting, this part was done.
Pick ‘n’ Mix
Next is the chart with all options and prices, which is used for adding ingredients to or removing them from the pizza. Dragging Type, Product, Vegetarian to rows and Price to columns gives us the basis for the chart:
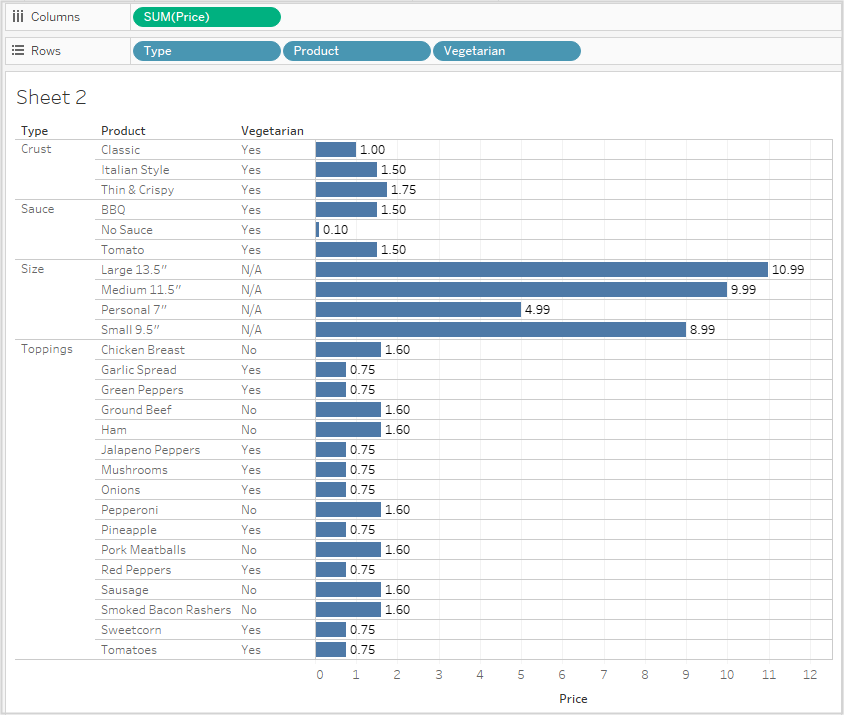
I changed the default number format for Price to be good ‘ol Pounds Sterling.
We just want a green dot (a pea?) to indicate whether an ingredient is vegetarian or not. For this, I created a calculated field, dragged it to the sheet, replacing Vegetarian and formatted the font for the field to be green:

Not getting upSET
Now we get to the core of the challenge. Right-click Product, Create, Set. Any member can be picked for now as this will be controlled by set actions later. Picking at least one from each type will help configuring the colours, though.
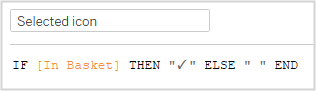
Membership of the set should be represented by a tick, so a similar approach is needed to the veggie icon above:
The problem is that when this is dragged to Rows in front of Product, Tableau orders the product by in/out of set, which we don’t want. The fix for this is to duplicate the Field Product with a CTRL-Drag to also have it to the right of the icon we just created:

The problem with this on the other hand is that when we hide the Product heading, both copies of it are hidden, so I created a further field, which was simply a copy of Product:

The first Product heading could then be hidden, thus preserving both the order of the columns and the items in the list.
United colours of Pizza
With most of the Marks card parameters (Label, Detail, etc.), you can simply drag multiple fields to them, one after the other. However, if you try to do this with Colour, any new field simply replaces the previous one. So how do you get more than one field to affect colour? Highlight the first field you want, CTRL-select the second field, then drag them BOTH to colour. You can now click on the Colour icon and configure the colours accoring to both fields:

What’s in the basket?
There are two charts that we need to build based on what has been selected; the list of ingredients on the right of the dashboard and the simple bar chart showing how much of our budget we have spent.
First the list of items. This is based on the “MIN(1) trick”, which replaces Price in Columns. The hidden header Type is also needed so that the ingredients are listed in the same order as elsewhere. We additionally need a filter to only show the ingredients that are in the In Basket set. The result is as below:
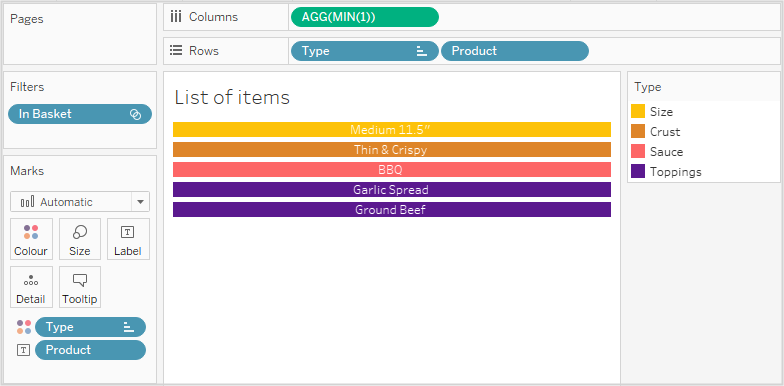
The axis for MIN(1) must be fixed to 0-1. I’ll fix he rest of the sizing when I’m building the dashboard.
How much have I spent?
The calculation for the cost of the basket is:

Dragging this to Columns and Type to Colour gives us the basic bar chart.
We now need to add labels to show the budget and the total cost.
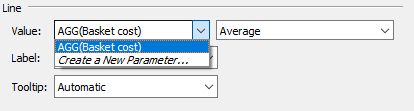
The budget is set via a parameter and is shown as a reference line. A handy trick with reference lines is to create a new parameter directly from the reference line dialog box:
From here I created the parameter Available Budget and edited the label as below. Note that with a custom label, you can combine Any text with data related to the reference line:
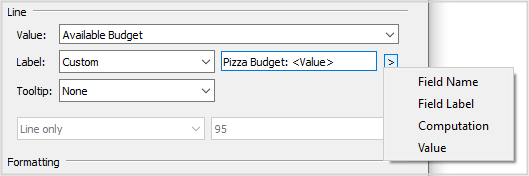
I then formatted the reference line text and set alignment to top and right
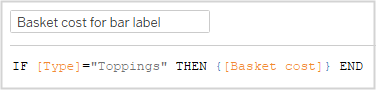
There should also be a label at the end of the bar. My first attempt at this was to create a label that would just appear for Toppings, the right-most ingredient type:
However, it was not possible to display this at the end of the bar:

Instead, I duplicated the Basket Cost pill, removed Type from colour, selected show label to get:

Then select dual axis, synchronise axes, right-click the axis at the top and select Move marks to back, did some formatting and the bar was done:

How’s the budget looking?
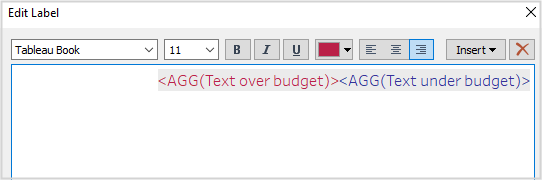
In Lorna’s dashboard, there’s a label that says how much above or below you are with the current choices. This should be coloured according to whether over or under. For this, I built two very similar calculated fields like the one below. The trick is that if the condition is not met, a null should be returned:

Both these fields are dragged to Text in a new sheet. Editing the label gives you the chance to set the conditional colour as only one field will ever be shown at the same time:
With that, building the dashboard can start.
The Build
I configured all of the tooltips and built the dashboard:
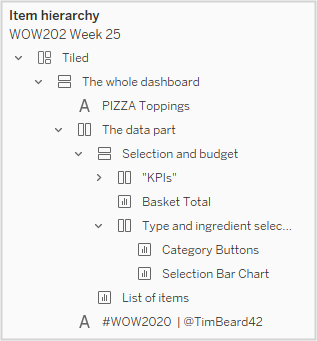
I know Lorna is a Container vizzer through and through (as opposed to using floating panels), so I took care to create a neat and labelled container structure:
Lights, Camera, Action!
Actions are the focus of this exercise, so I’ll go through each of them. The main interactions are: Select Ingredient Type; Add ingredient to pizza; Remove ingredient from pizza. Plus a couple of action hacks!
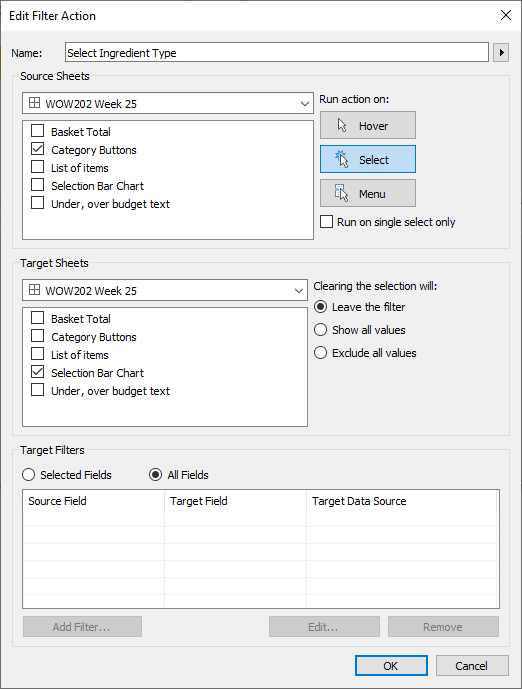
Select Ingredient Type filter action is straightforward. This acts as a filter on the chart that then allows the user to select ingredients:
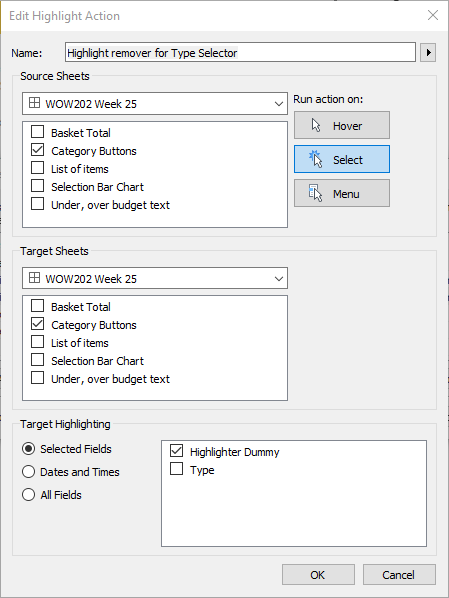
The problem is that once you have selected an ingredient type, Tableau leaves you with a highlighted button, which we don’t want here:

To fix this, create a dummy field, which can contain something simple like “”, and drag this to Details in the appropriate worksheet. Then create a dashboard highlight action that only works on this dummy field:
To add an ingredient to the list, we need a set action that acts upon the ingredient selection bar chart:
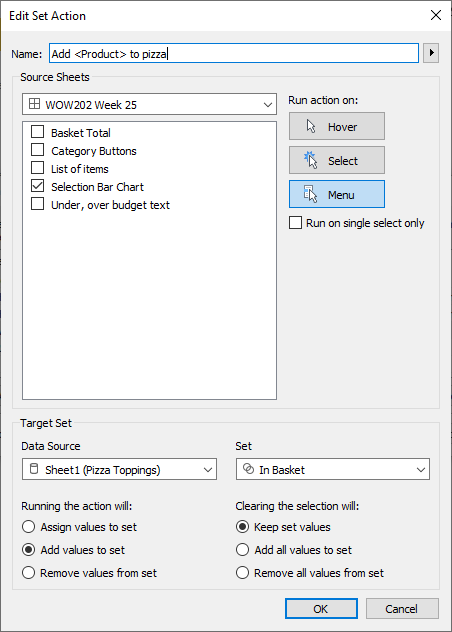
The key addition in 2020.2 is in the bottom section. The previous behaviour was simple “Assign values to set”, but now we can add and remove members individually.
Two further things to note in the dialog box above:
- The action is set to run on Menu. This means that the user must click on the bar, then action options will appear at the bottom of the tooltip.
- The arrow to the right of the set action name at the top allows you to include contents from fields into the text that the user sees.
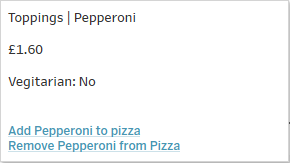
Note that I also edited the tooltip to contain a bunch of spaces followed by a white full stop in the top line to force the tooltip to be the width that I wanted.
I also added the dummy action to the ingredients selection to avoid the same highlighting issue as above. The resulting actions are:
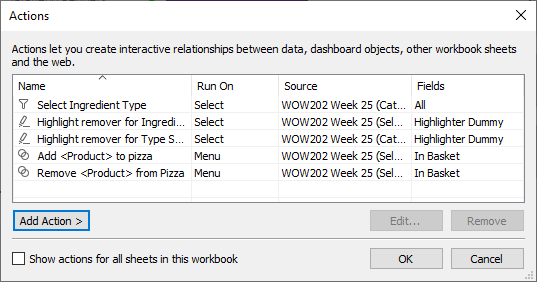
And with that, the dashboard is done!