It’s been a couple months, after a broken pinky (causing typing difficulty) and the holidays, I’m ready to start the new year. This week’s challenge is from Candra, one of this year’s new coaches. Taking it back to straight table calculations, which is always a good exercise for those of us that tend to reach straight for the LODs.
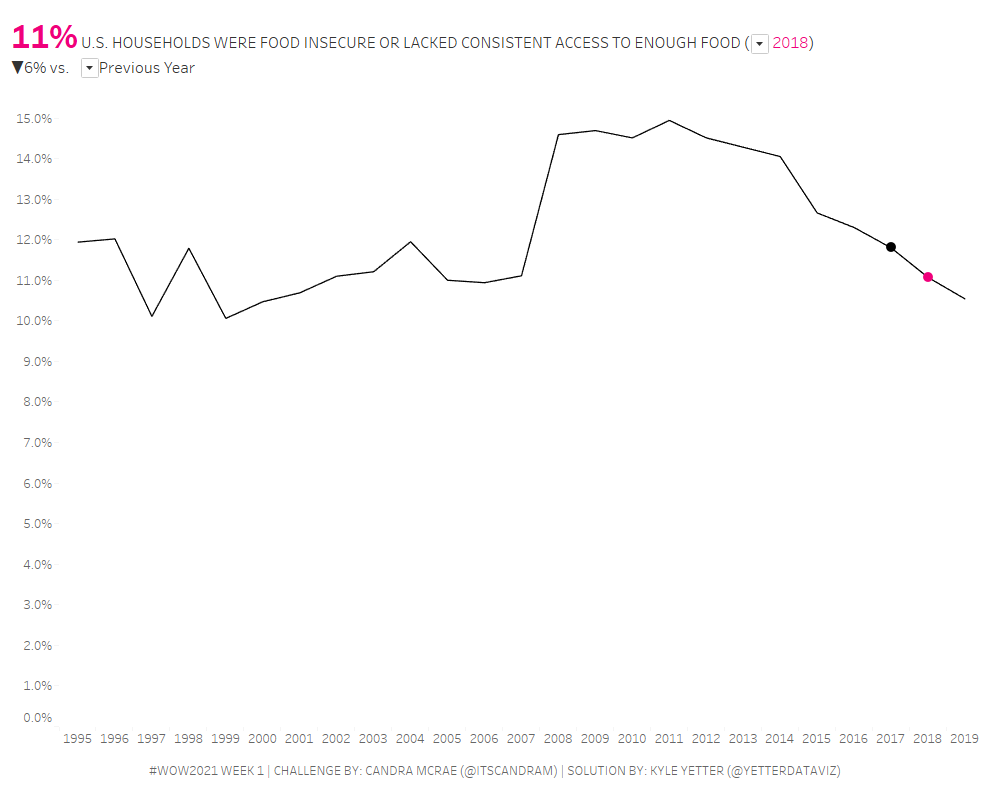
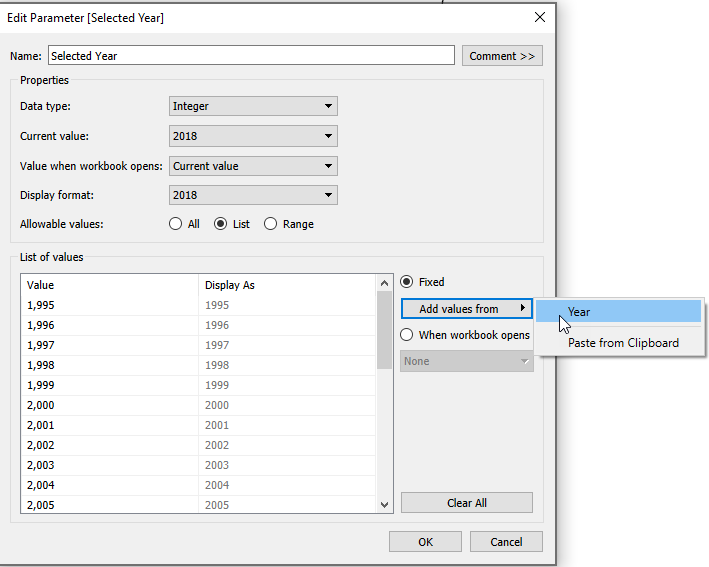
I started out creating the line chart, with Year on Columns and SUM(Food insecurity) on Rows, and changed the line color to black. I gathered from interacting with Candra’s viz that the selected year and which year to compare to were parameters, so I created those next. One as an Integer, with the values added to the list from the Year field.
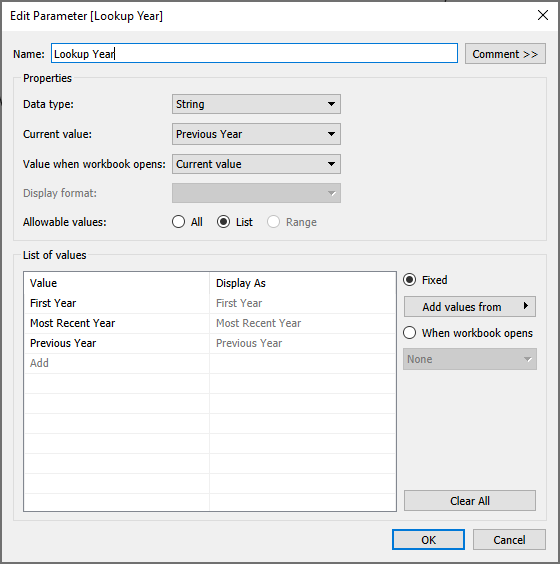
The other as a String with the three values identified.
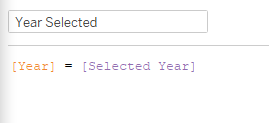
Then I created a boolean to identify the year based on the parameter selection:
Then I created another to identify the comparison year:
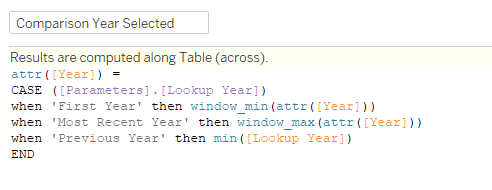
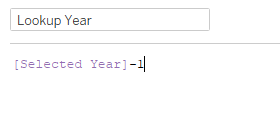
I used WINDOW_MIN and WINDOW_MAX to get the first and most recent years, and the Lookup Year to get the previous year to the year selected:
With the two years identified, I decided to try a dual axis to add the dots to the line chart. So I created a calc to give me the SUM(Food insecurity) if the year was Year Selected or Comparison Year Selected:
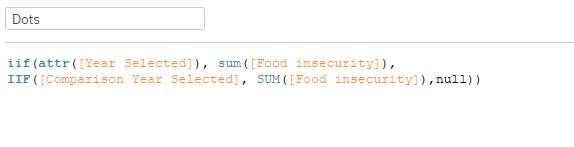
Then I added that to Rows and set the Dual Axis and Synchronize Axis. When I add Year Selected to Color for that mark, I get a T/F so I set the color accordingly.
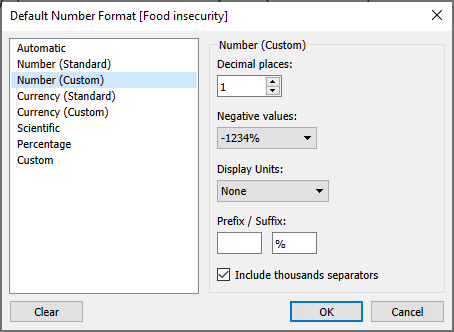
To format the numbers, since the requirements said not to add the % with a calc, I remembered the Suffix option in the number formatting:
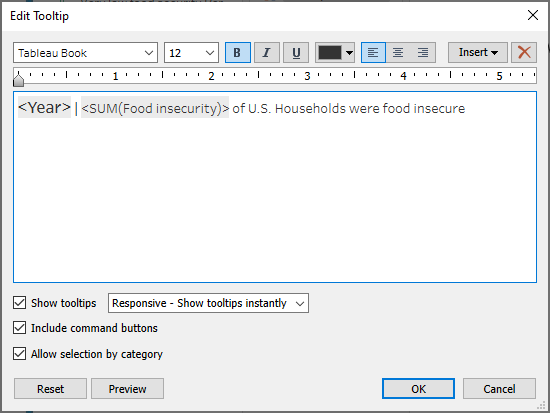
After formatting I did a quick setup of the tooltip:
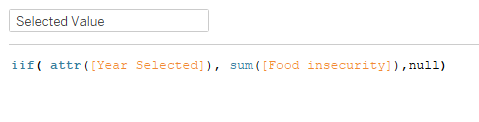
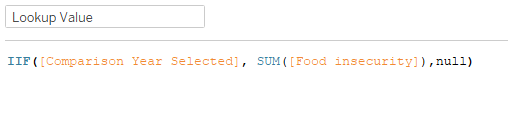
The last thing I needed was the variance between the selected year and the comparison year. So I created a calc for the selected year value and the lookup year value:
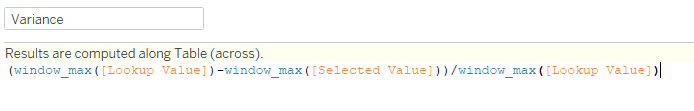
With these two values, I could then create a variance calc. I used WINDOW_MAX in order to get just the values:
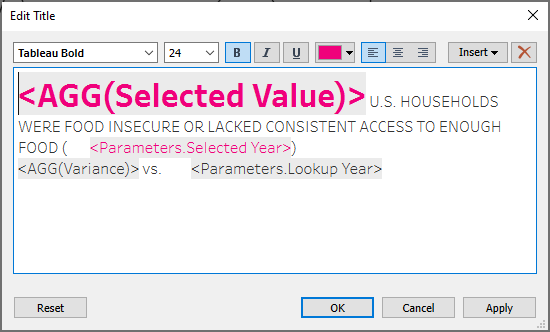
That was the last piece I needed to create the title. Since I needed to include the Selected Value and the Variance I decided to use the worksheet title:
After this, I added the sheet to the dashboard, and then floated the parameter dropdowns into the spaces in front of the Selected Year and the Lookup Year parameter values.
As an added bonus, I decided to add a parameter action that would change the Selected Year when you click on the line chart:

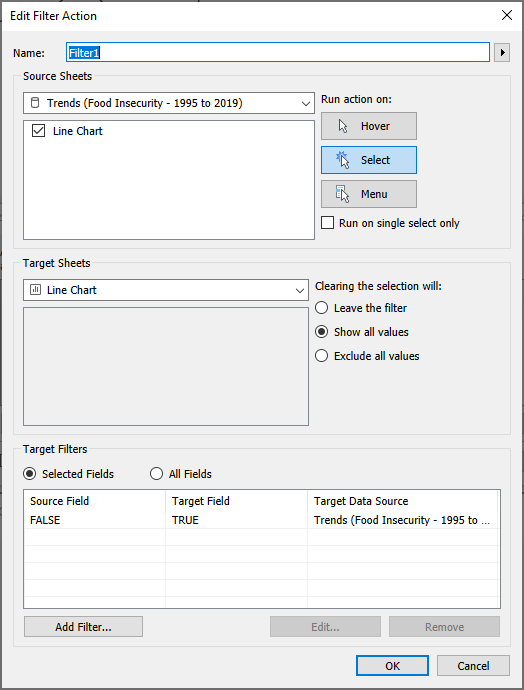
Then I added a TRUE/FALSE filter to automatically deselect the year when clicking on the line:
And we’re done with the first challenge of the year!